Status:Ongoing analysis Material from: Linus
Discussed in the following Daily reports:
Picture
1. Impact
Heavy monsoon rain during the first week of September led to flooding in north-eastern Pakistan, and has killed about 280 people.
2. Description of the event
Information about the event can be found here:
http://floodobservatory.colorado.edu/Version3/2014Pakistan4179.html
Daily accumulated precipitation
There are no images attached to this page.
The plots above shows the observed 24-hour precipitation (symbols) day-by-day for the first week of September and short HRES forecast (36-60h). The major rainfall started on the 3 September and continued until 6 September. Please note that we currently missing observations from India.
The figure above shows the 3-day accumulation of precipitation between 3 September 00UTC and 6 September 00UTC. Close the border between Pakistan and India two stations reported more than 300 mm.
3. Predictability
3.1 Data assimilation
3.2 HRES
Accumulated precipitation from HRES for 3-6 September
There are no images attached to this page.
The plots above shows the accumulated precipitation in HRES accumulated for 3-6 September (72 hours). The area extent of the precipitation is reasonable. (I suspect that we could have a few gridpoint storms here.)
3.3 ENS
Prob. >100 mm in 72 hours
There are no images attached to this page.
The plots above shows the probability for more than 100 mm during the 72-hour period (3-6 September) from forecasts with different initial times.
EFI for 3-day precipitation
There are no images attached to this page.
The plots above shows the EFI and SOT for 3-day accumulation of precipitation.
In both the probability maps and the EFI a strong signal is present for the rainfall from 31 August and onwards.
3.4 Monthly forecasts
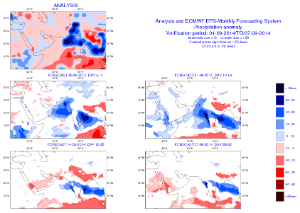
The figure above shows the ensemble mean anomalies for the week 1-7 September from different monthly forecasts, including the analysis (top panel). The first forecast is from 28 August. As seen in the EFI plot the signal was not strong for this forecast but a wet anomaly is present for southern Pakistan. A wet anomaly was also present in the forecast from a week earlier (21 August), but still a bit too far south. The plots below shows the same as above but including the Monday runs.
Weekly anomalies of precipitation
There are no images attached to this page.
3.5 Comparison with other centres
3.6 EFAS
The plot above is from Glofas from 6 September.
Discharge forecast for Chenab River
There are no images attached to this page.
The plots above shows the discharge forecast for River Chenab at a point close to Multan. The forecast from 1 September already has a signal for flooding, as expected from the rainfall forecasts above.
4. Experience from general performance/other cases
5. Good and bad aspects of the forecasts for the event
- The heavy rainfall seems to have been well predicted from 31 August (lead time day 3-6).


