Status:Ongoing analysis Material from: Linus
Discussed in the following Daily reports:
Picture
1. Impact
2. Description of the event
Dail accumulated precipitation
There are no images attached to this page.
3. Predictability
3.1 Data assimilation
3.2 HRES
3.3 ENS
3.4 Monthly forecasts
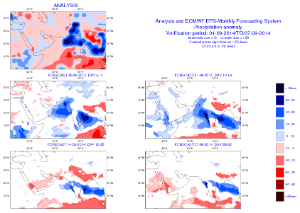
The figure above shows the ensemble mean anomalies for the week 1-7 September from different monthly forecasts, including the analysis (top panel).
3.5 Comparison with other centres
4. Experience from general performance/other cases
