Status:Ongoing analysis Material from: Tim, Ivan, Linus, Ervin, Mohamed
1. Impact
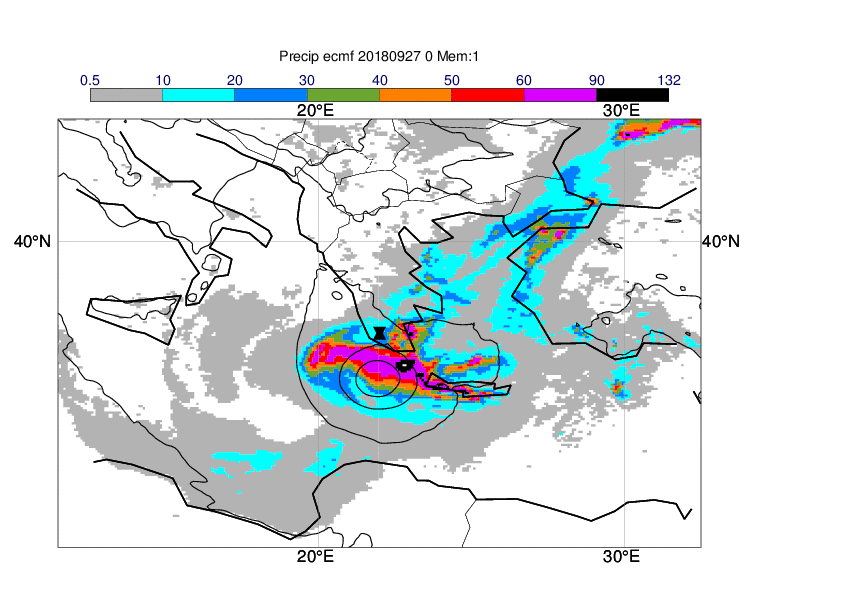
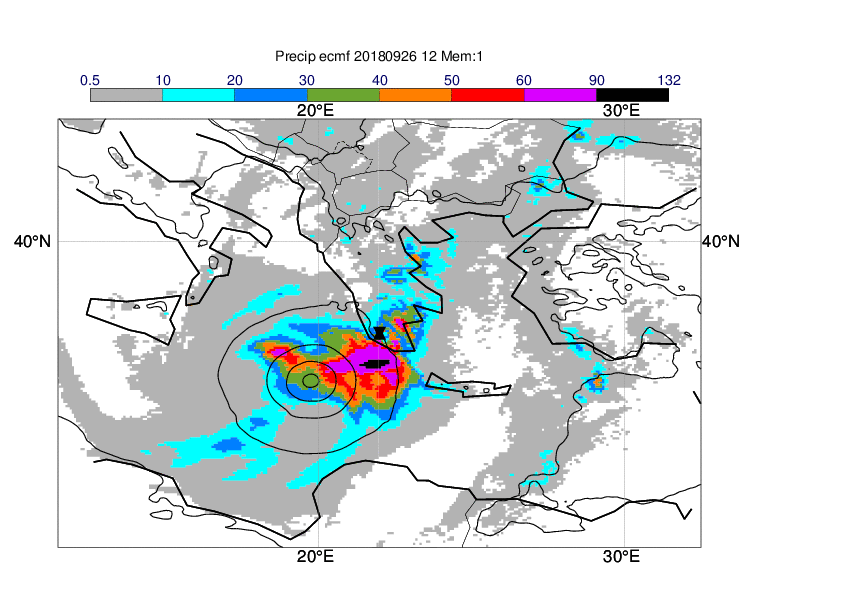
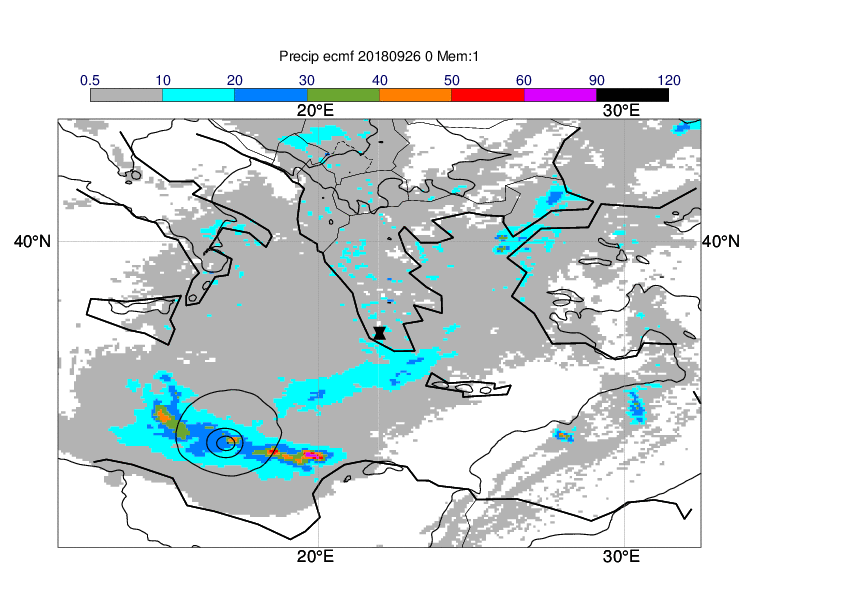
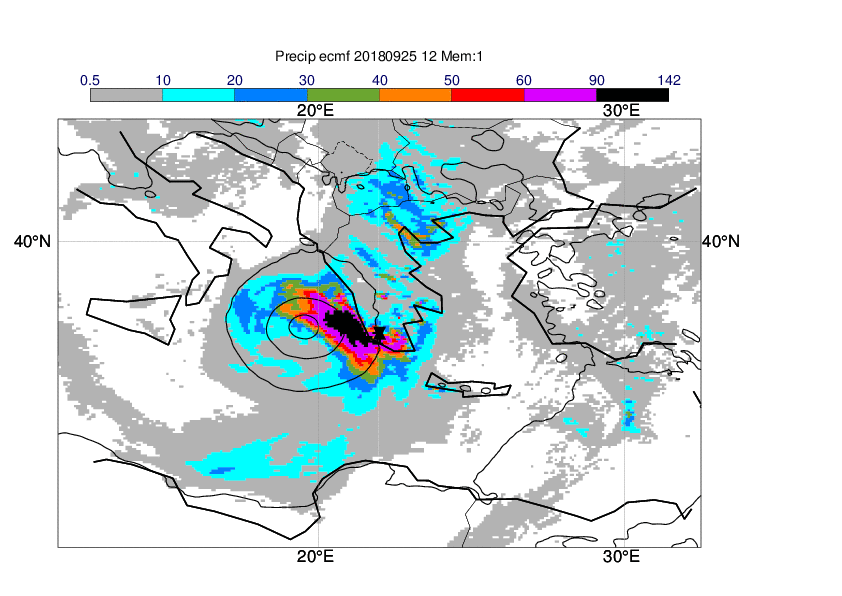
On 26 September the Medicane Zorbas made landfall close to Kalmata on the south-western coast of Greece, and caused heavy rainfall in the country. The prediction of the cyclone was associated with large uncertainties regarding the path and intensity.
2. Description of the event
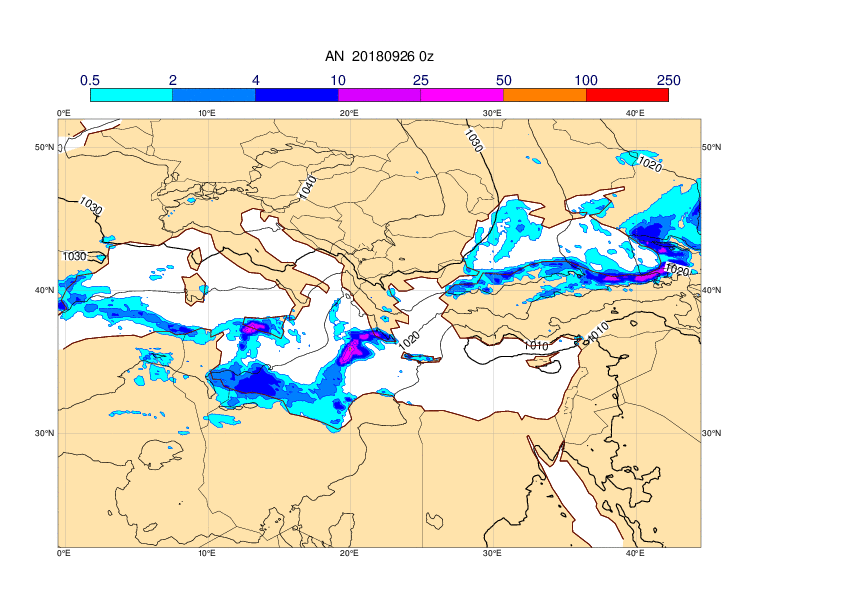
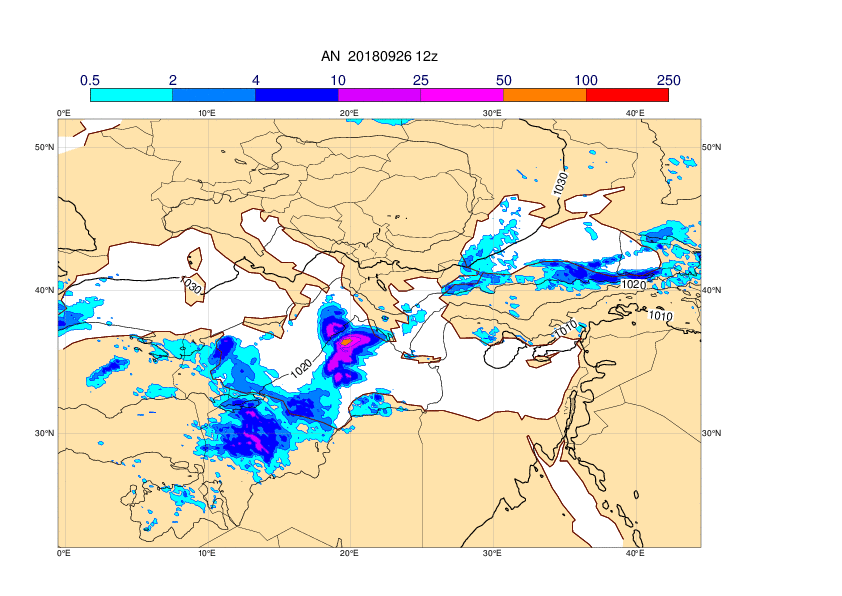
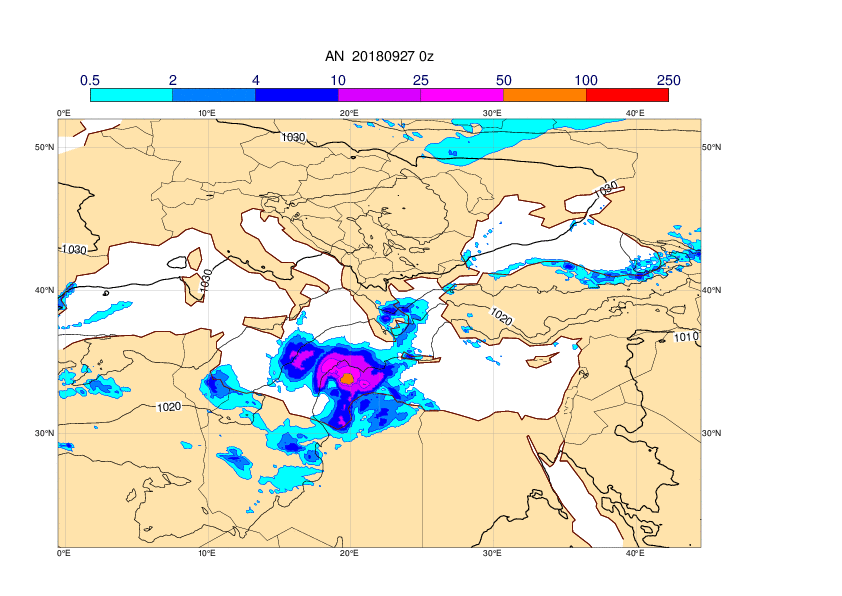
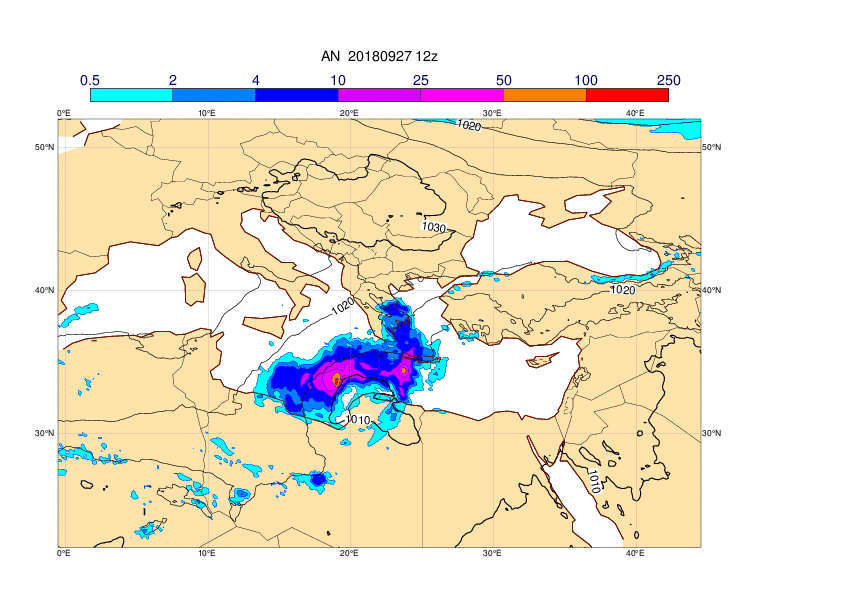
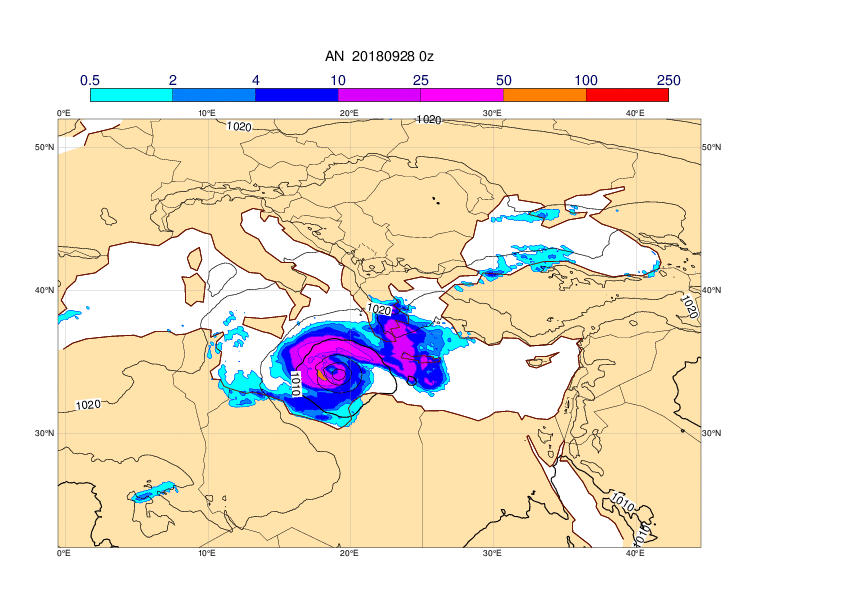
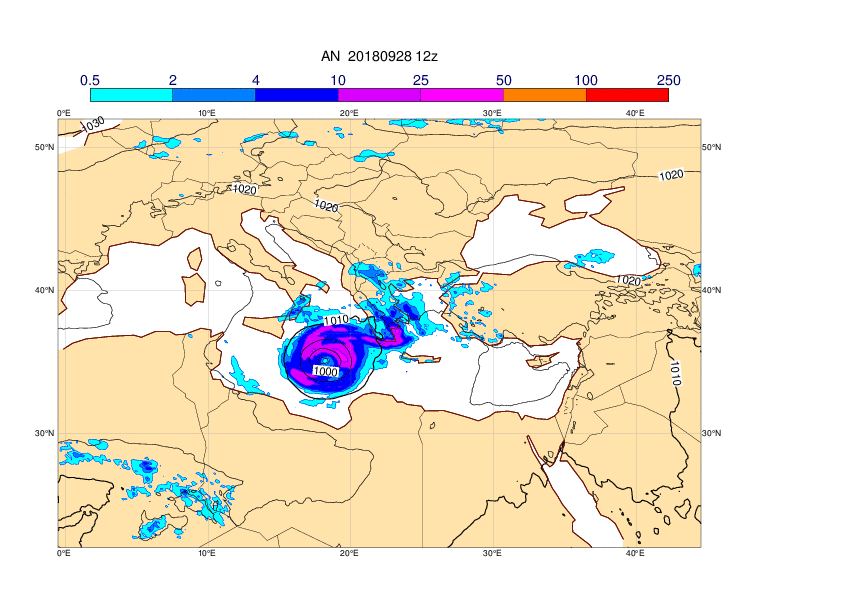
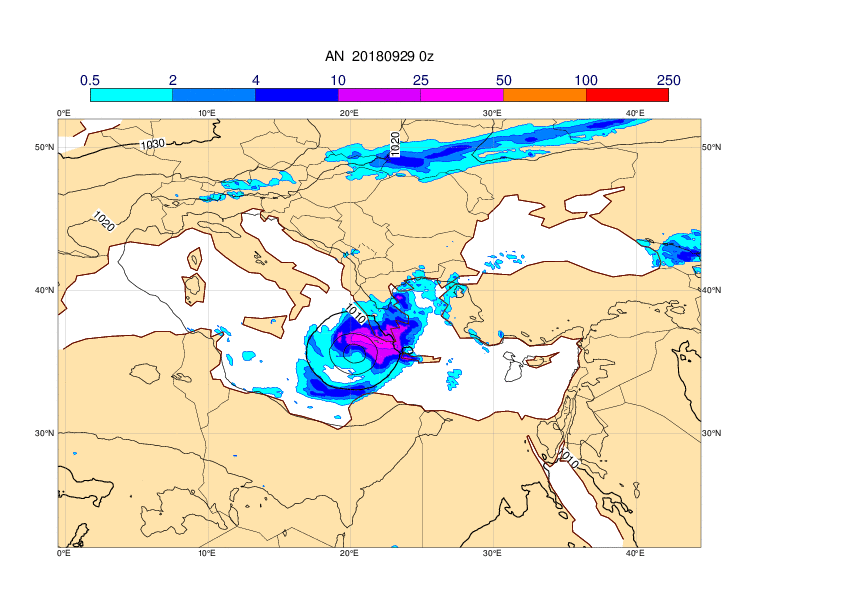
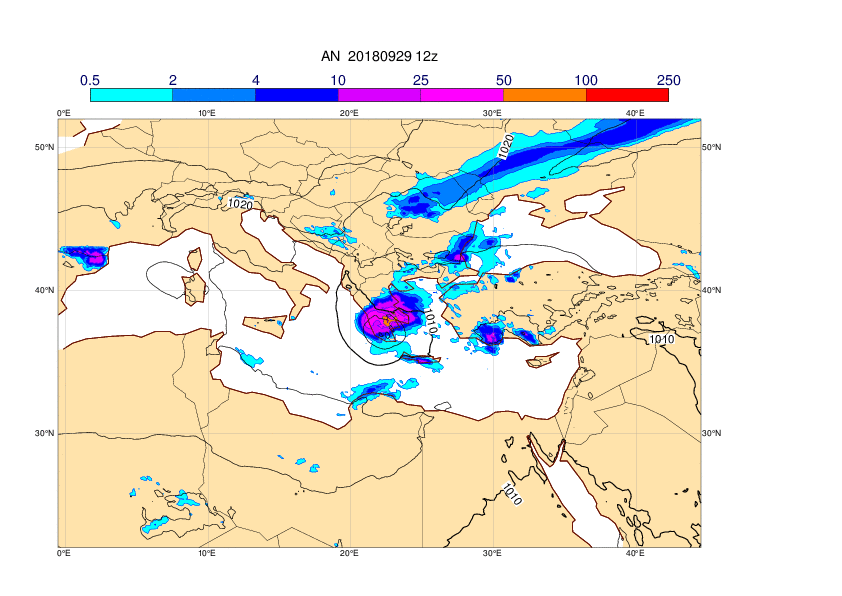
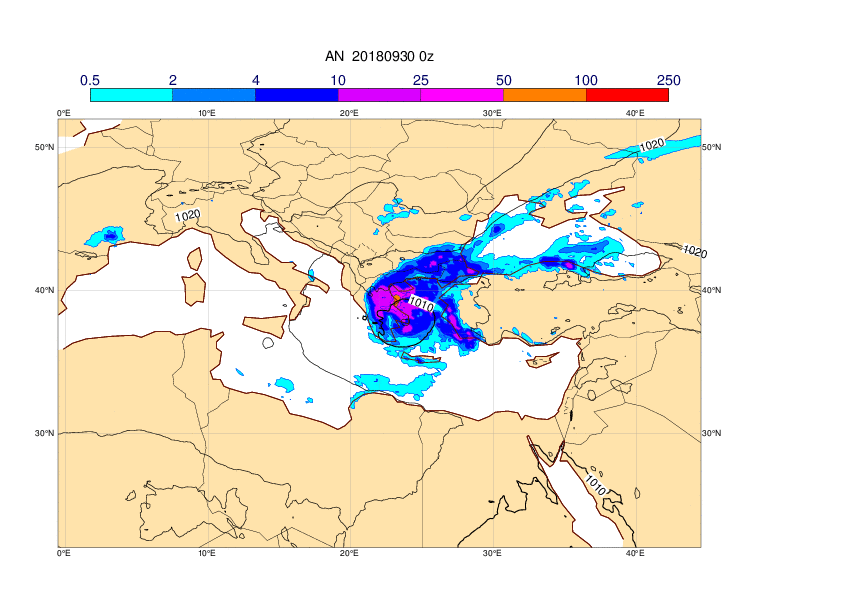
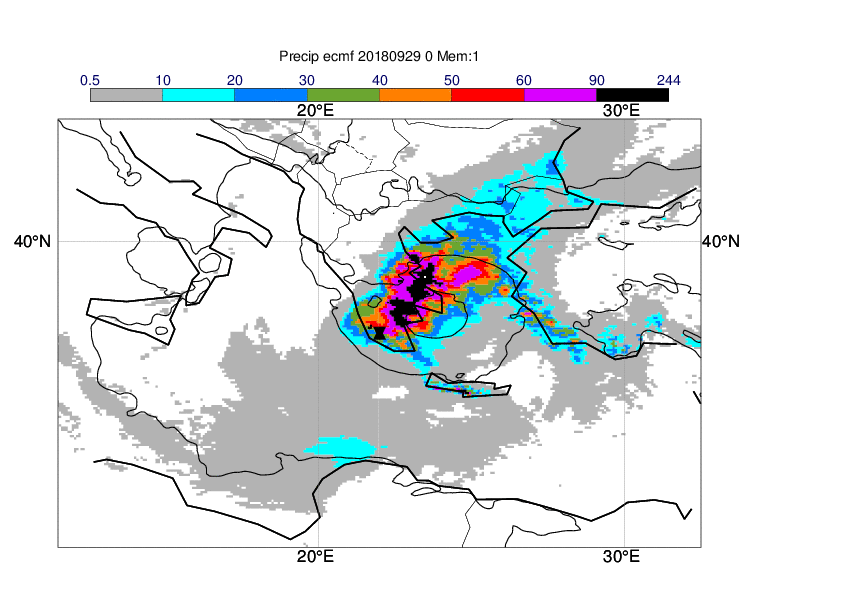
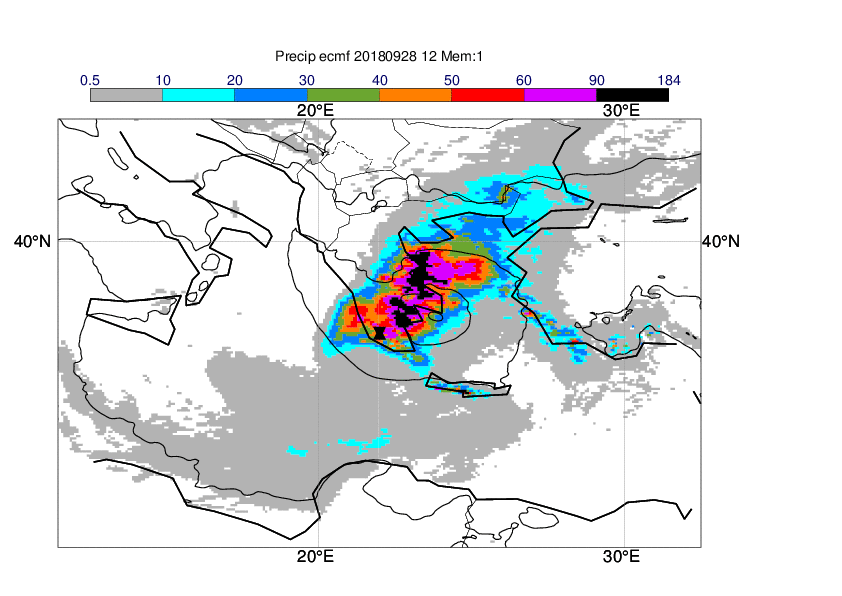
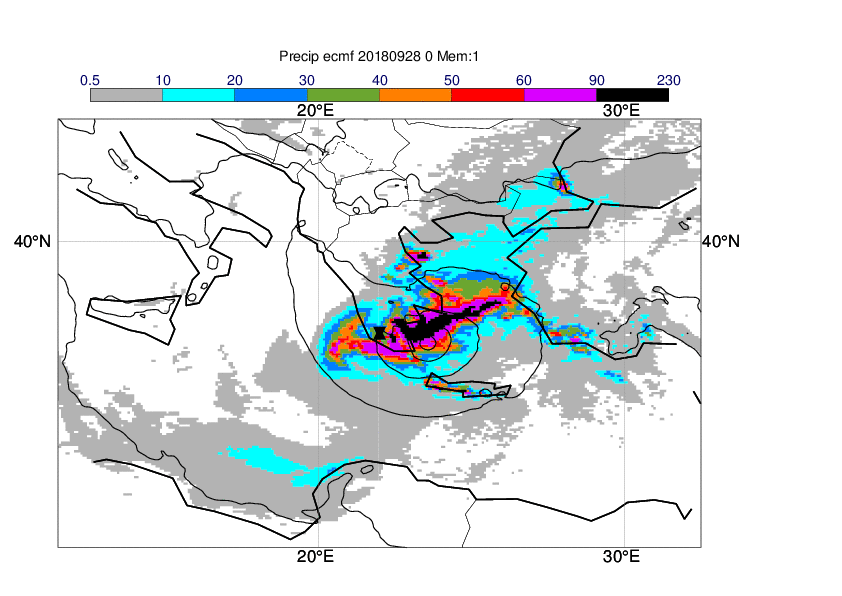
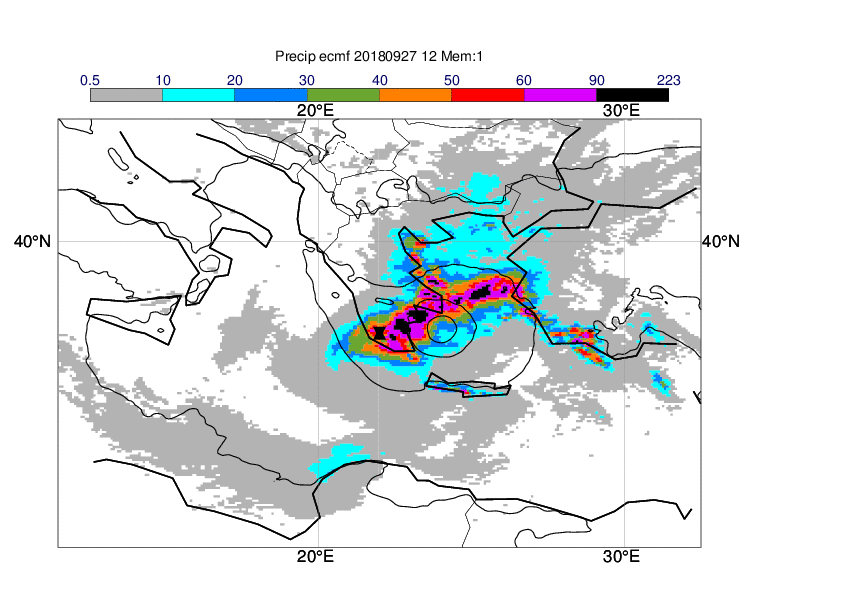
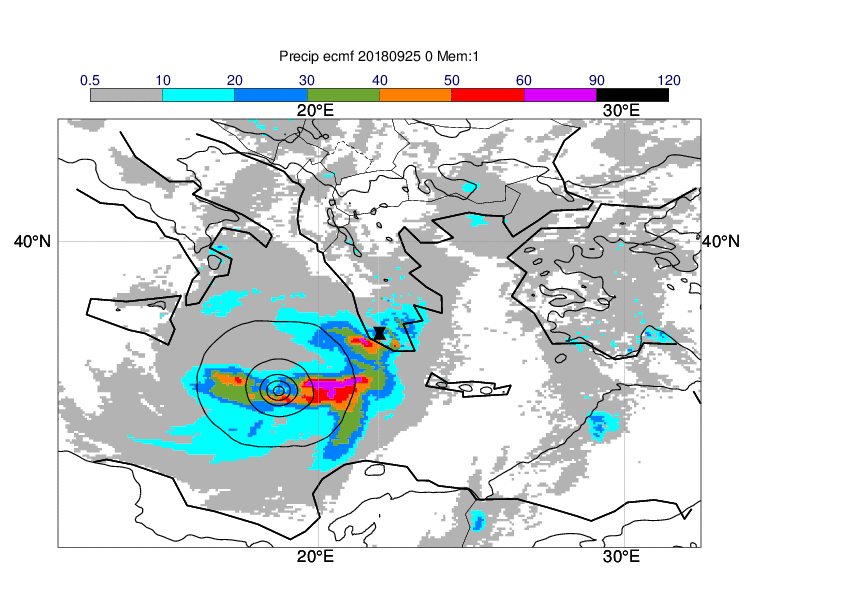
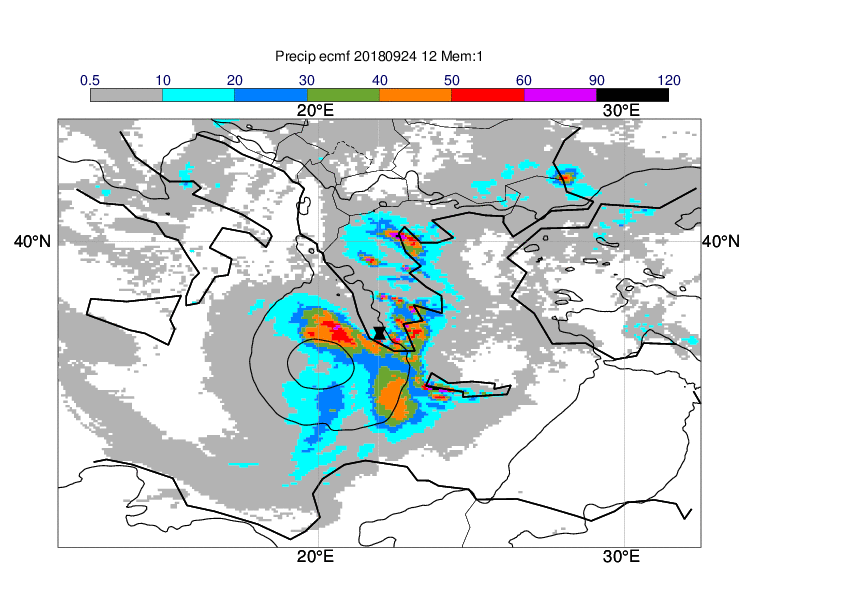
The plots below show analyses of MSLP and short forecasts of 6-hour total precipitation covering 26 September 00UTC to 30 September 00UTC, every 12th hour.
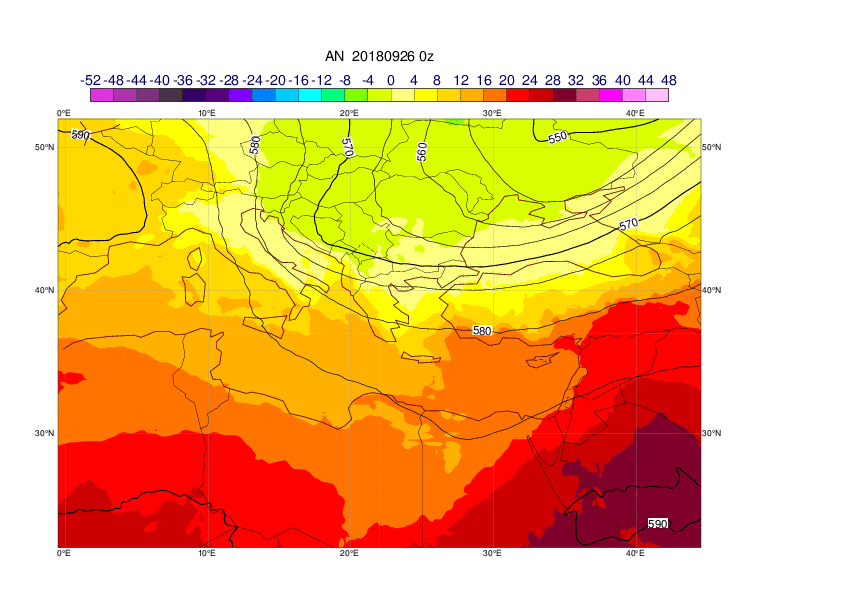
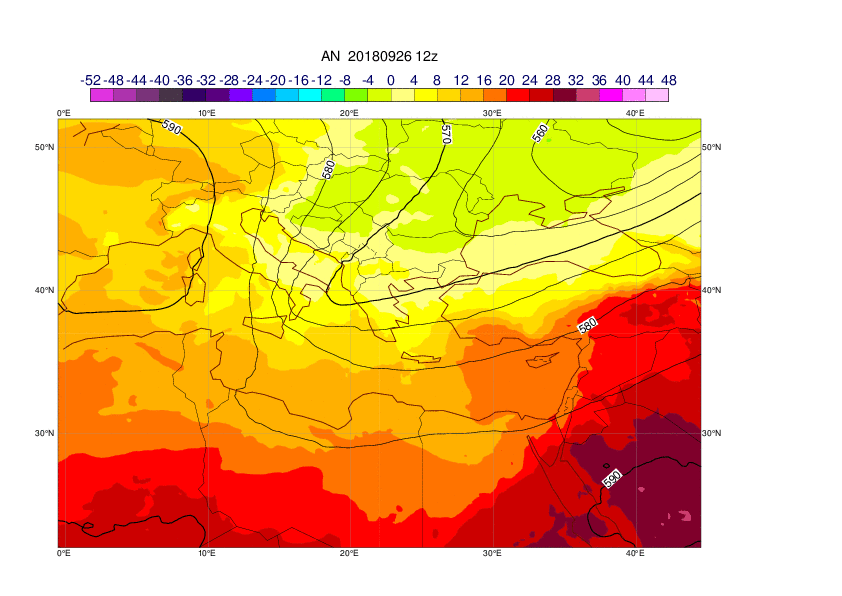
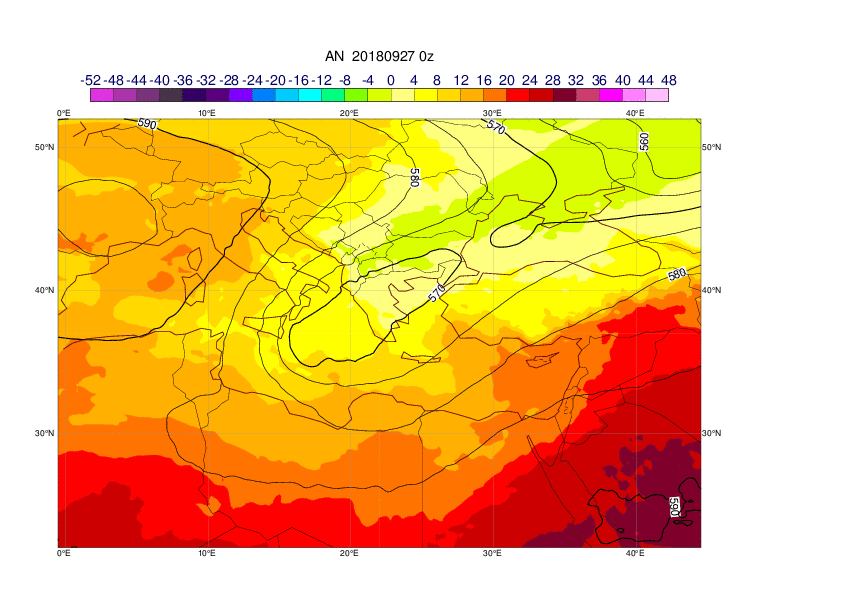
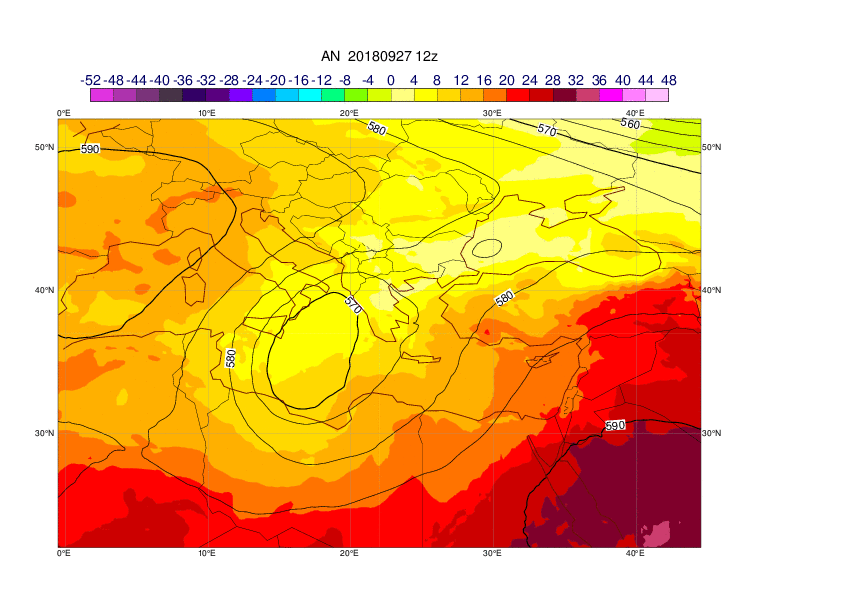
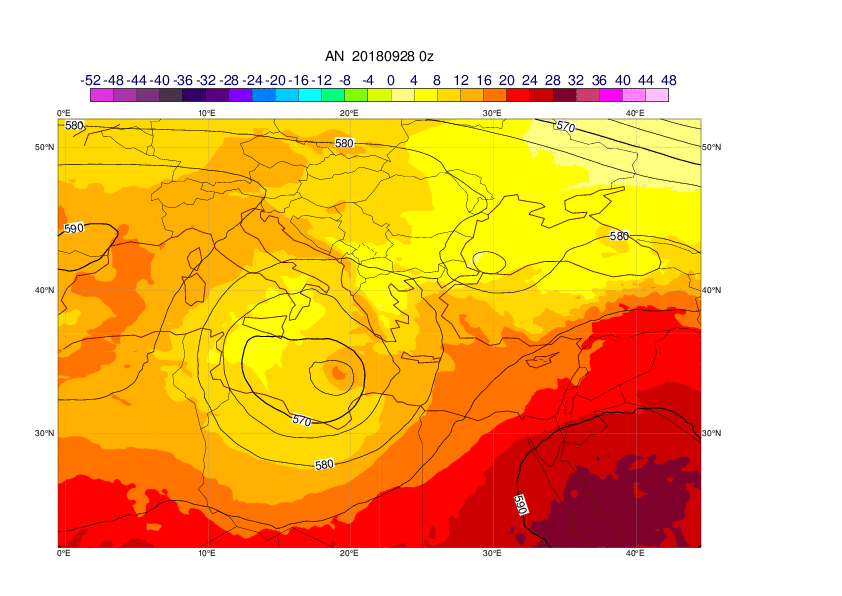
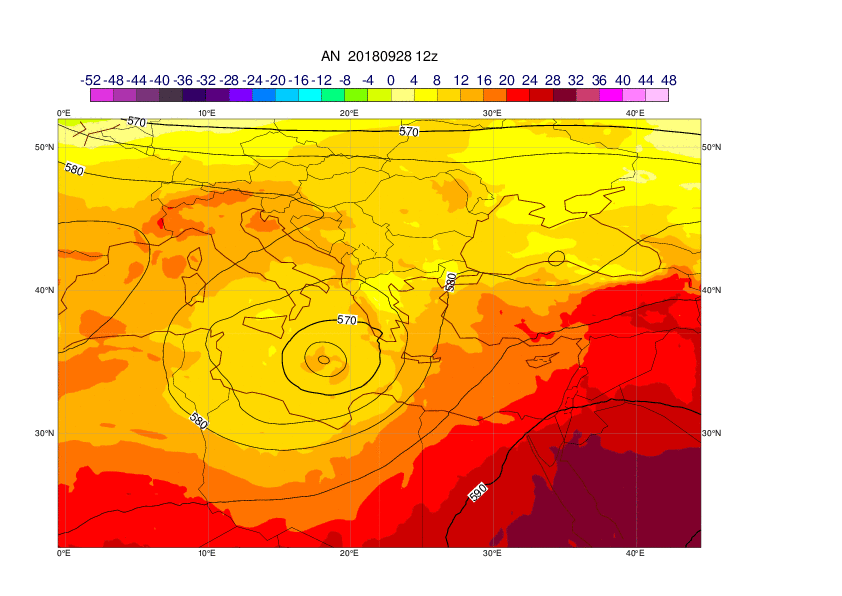
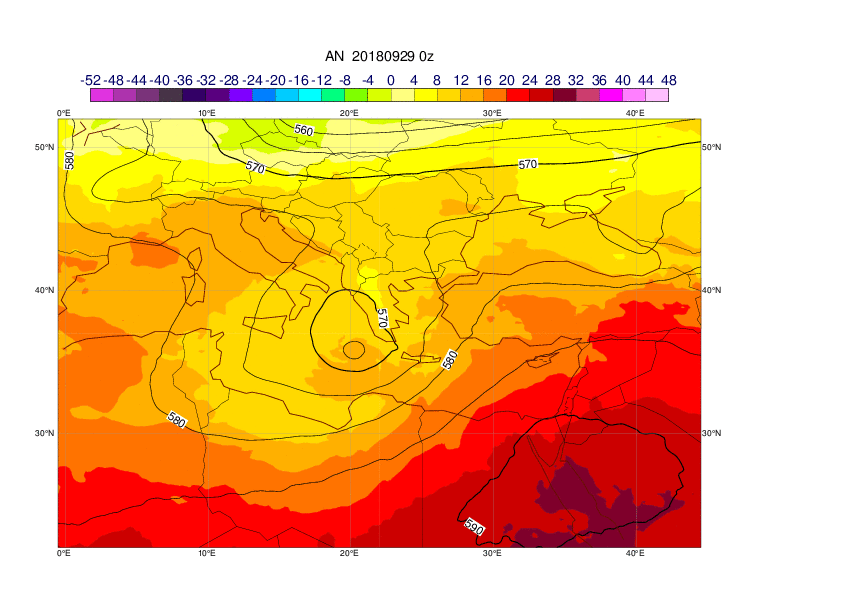
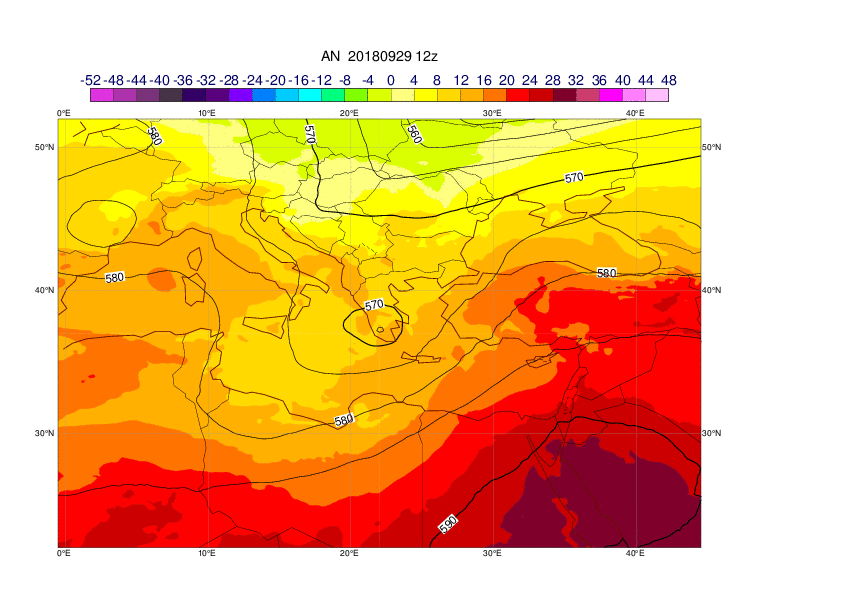
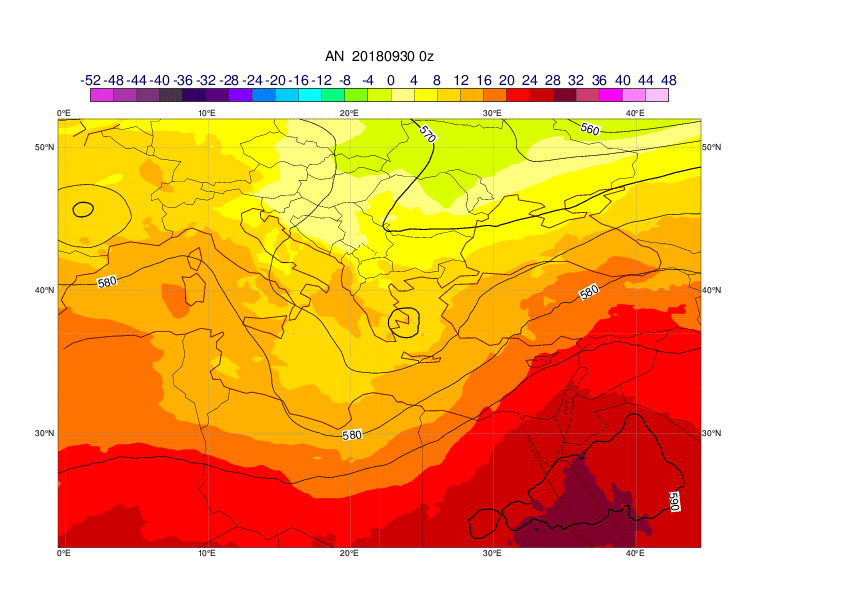
The plots below show analyses of z500 (contour) and T850 (shade) covering 26 September 00UTC to 30 September 00UTC, every 12th hour.
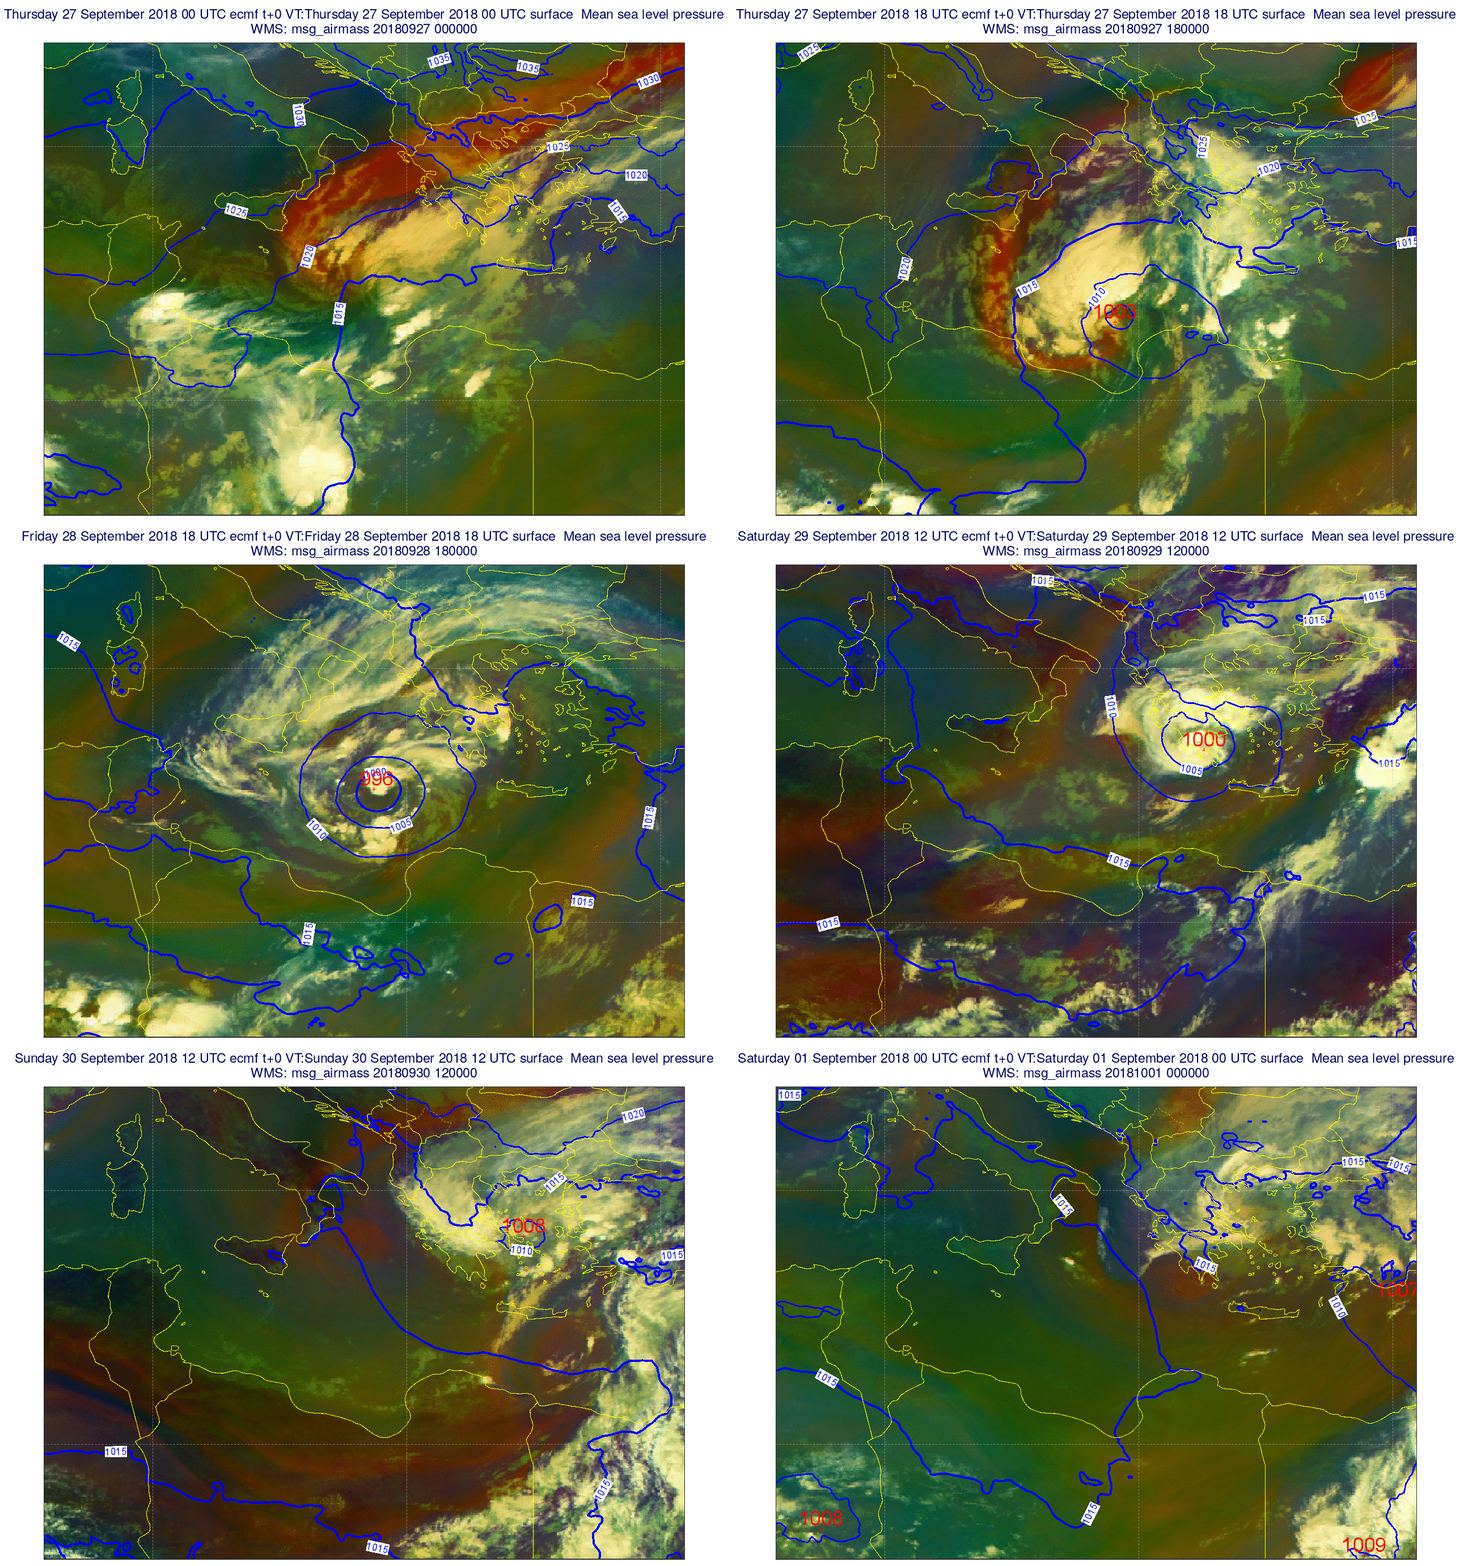
Air mass RGB animation from 27 September to 30 September 2018 inclusive.
ECMWF analysis of MSLP and air mass RGB, animation every 6 hours covering the period from 27 September 00UTC to 1 October 2018 00 UTC.
The plots below show ASCAT observations near the cyclone (for 29th 0851UTC) and wind gust observations (max on 28-29 October).
3. Predictability
3.1 Data assimilation
The panels below show analysis and observations for Zorbas on 29th of September at 09 and 12 UTC. The results highlights that the cyclone was to shallow when the cyclone makes landfall. The 9z analysis is about 997 hPa, while the 12z analysis (both LWDA) is about 1000-1001 hPa. The SYNOP observations in the area are 992 and 1000.5 at 09z and 999 and 991 (two different sources have slightly different values for this lowest observation in Kalamata). Plus it is important to stress that the ASCAT winds show the intense cyclone at 8:51 UTC just southwest from these MSLP observations. At 09z the difference between the OBSs is 8.5, while at 12z ~7-8 hPa. So this actually suggests that the gradient is correct, and with the assumption that we can have based on the ASCAT wind on the cyclone centre at 09z, the real centre pressure has to be below 990 hPa, probably close to 985 hPa or so, at least. Unfortunately our analysis as it seems could not really use the observations and ASCAT well enough to make the cyclone deeper. ASCAT usage chart suggests that there was a position error of the feature (slightly to the south West). The large negative pressure errors (shown in the time series) suggest this as well. ASCAT winds seem to adjust things but the impact was limited due to the partial coverage of the cyclone. Surface observations with large departures had low weight and given their reduced number they didn't manage to move the system. It is easier for observations to strengthen the feature than shifting the position of the system.
The plots below show the observation statistics for surface pressure from Menhoni (observation in top left above), Kalamata airport from synop (middle) and from the same station but metar (right). It is clear that the assimilation did not fit the observation at Kalamata.
3.2 HRES
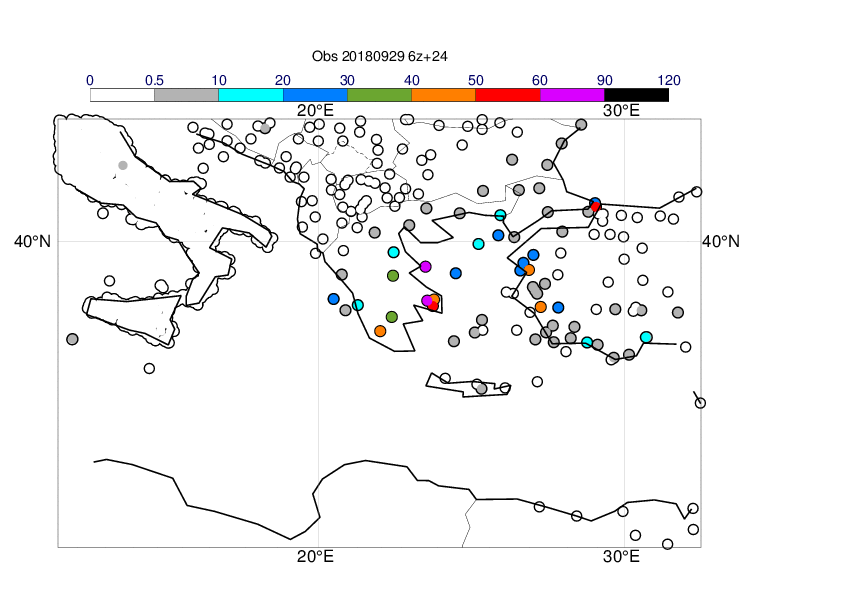
The first plots below shows (the few) observations of 24-hour precipitation 29 September 06z to 30 September 06z and the following plots HRES forecasts from different initial times valid the same time. The plots also includes MSLP valid at 18UTC on 29 September.
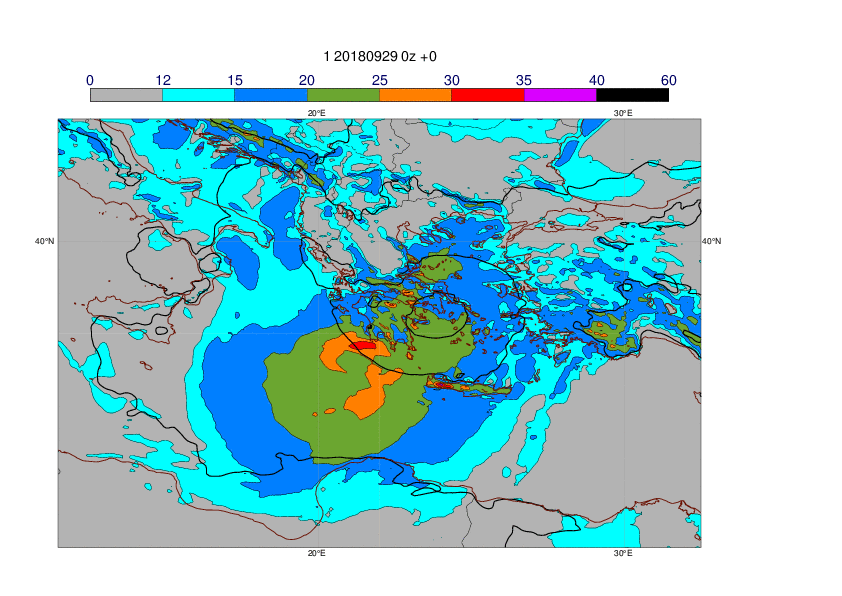
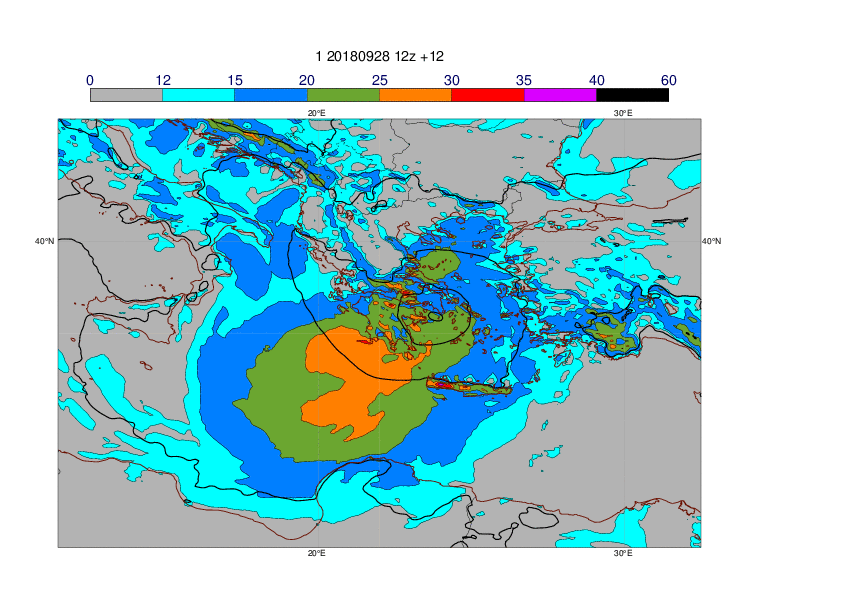
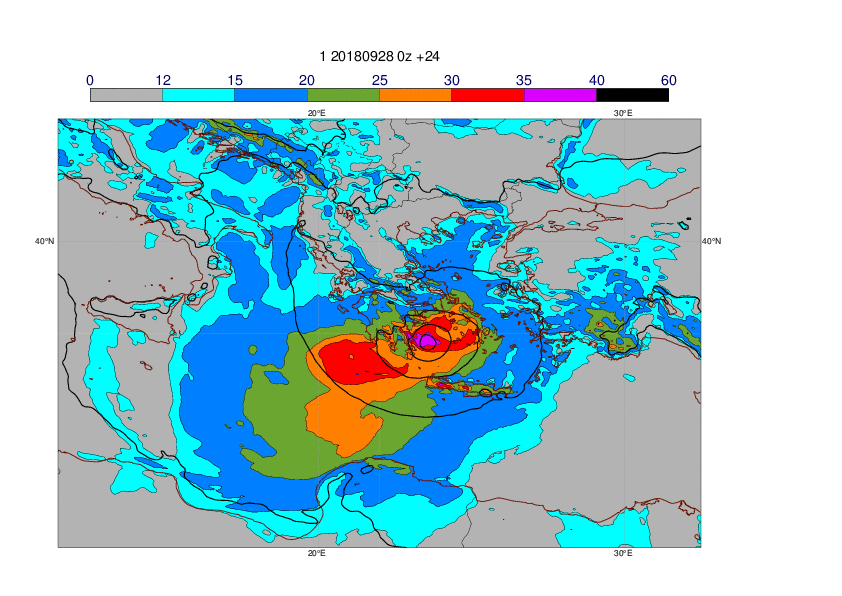
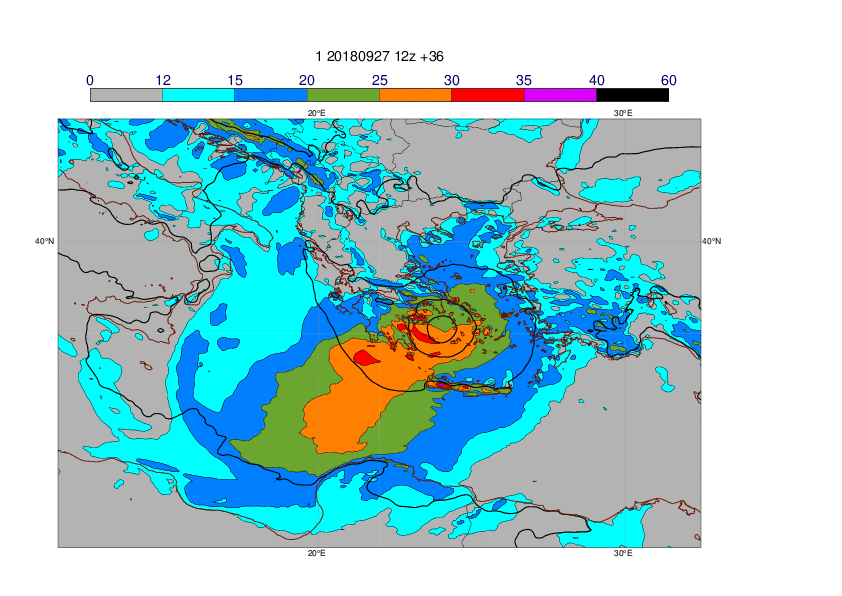
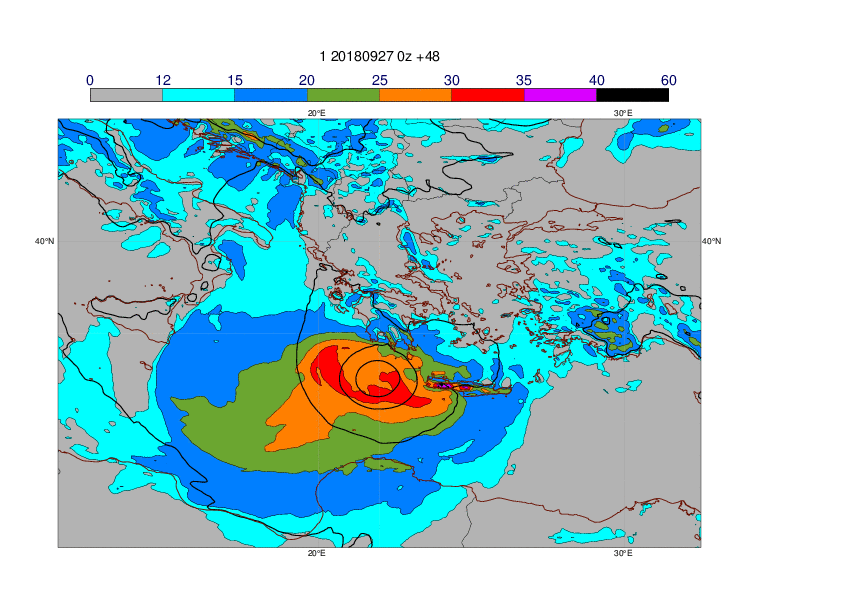
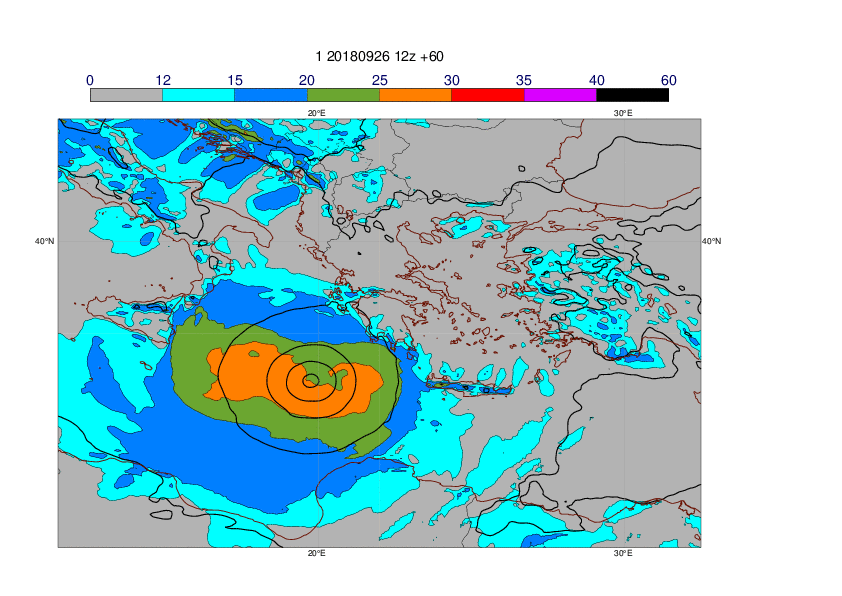
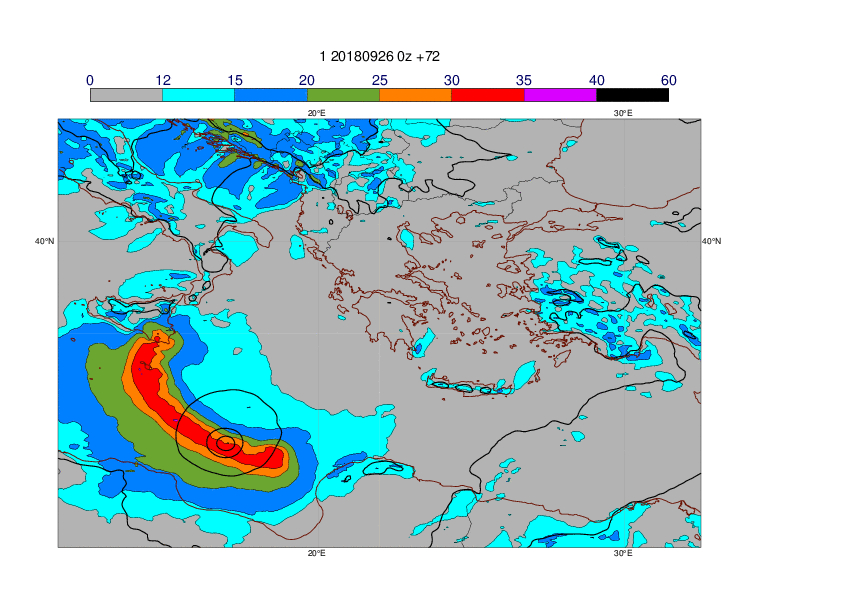
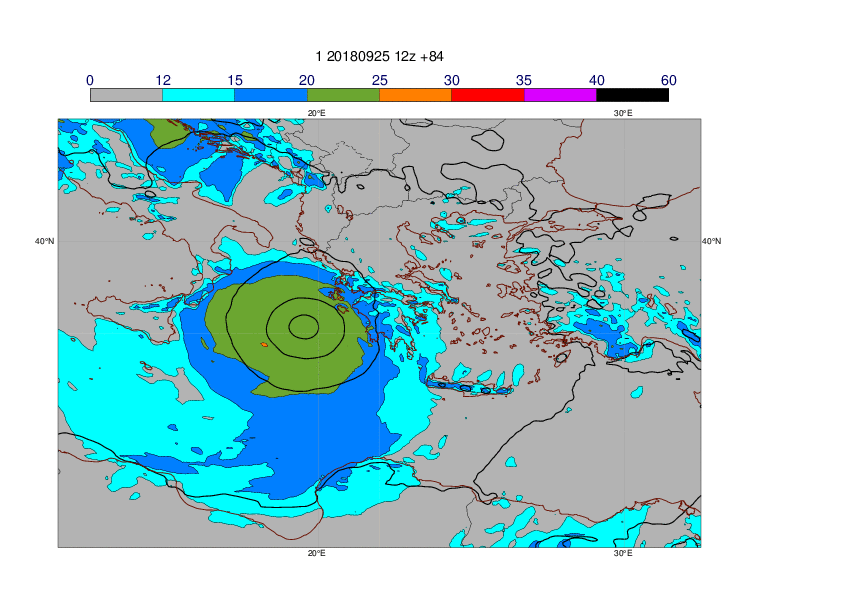
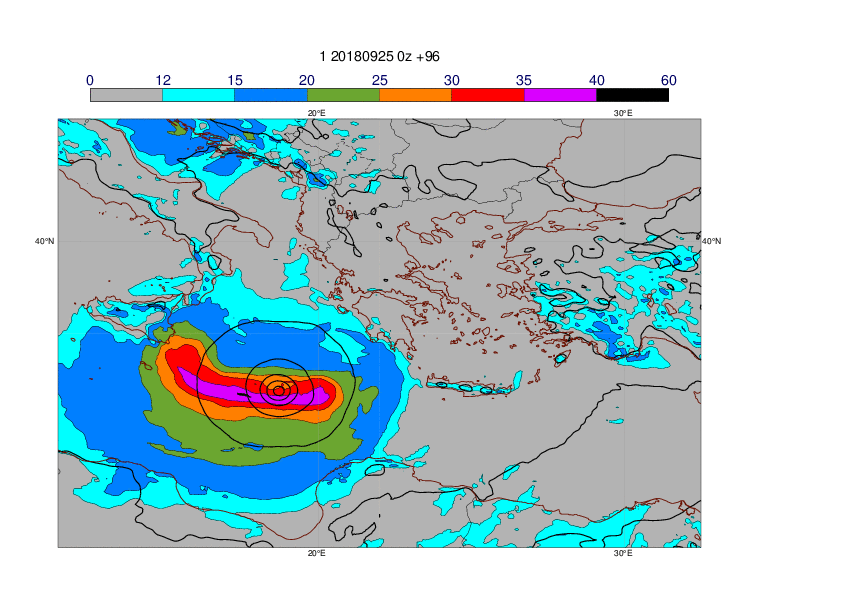
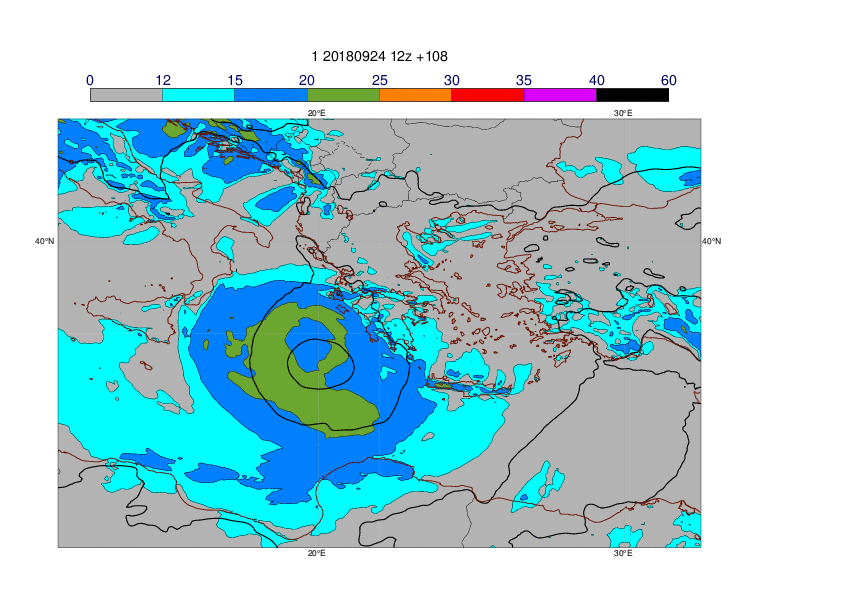
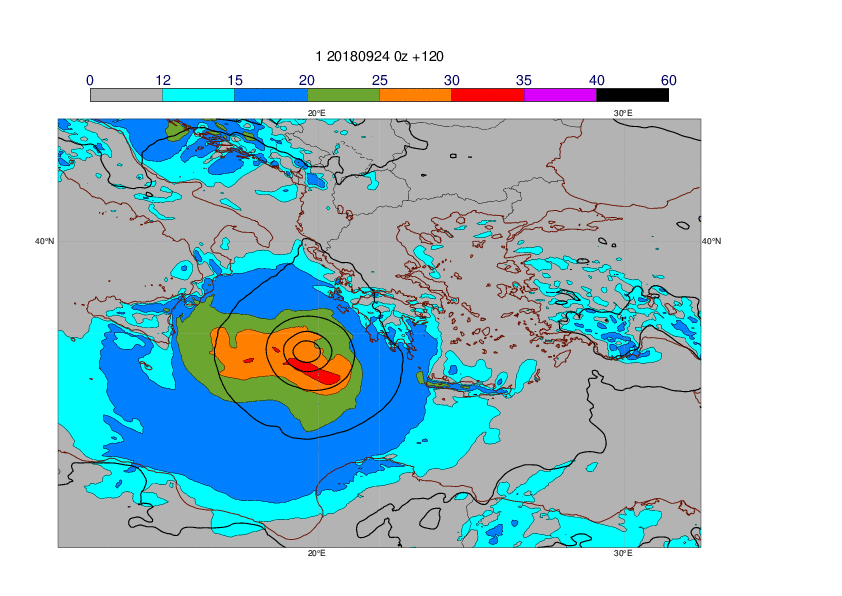
The plots below show HRES forecasts for 24-hour maximum wind gusts valid 29 September (shade) and MSLP valid 29 September 18UTC (contour).
3.3 ENS
The plots below show Dalmatian plots (with max precip) from 29 September (first plot) to 24 September (last plot), from the 00z runs, verifying at 12z on 29 September (when the cyclone reached Greece).
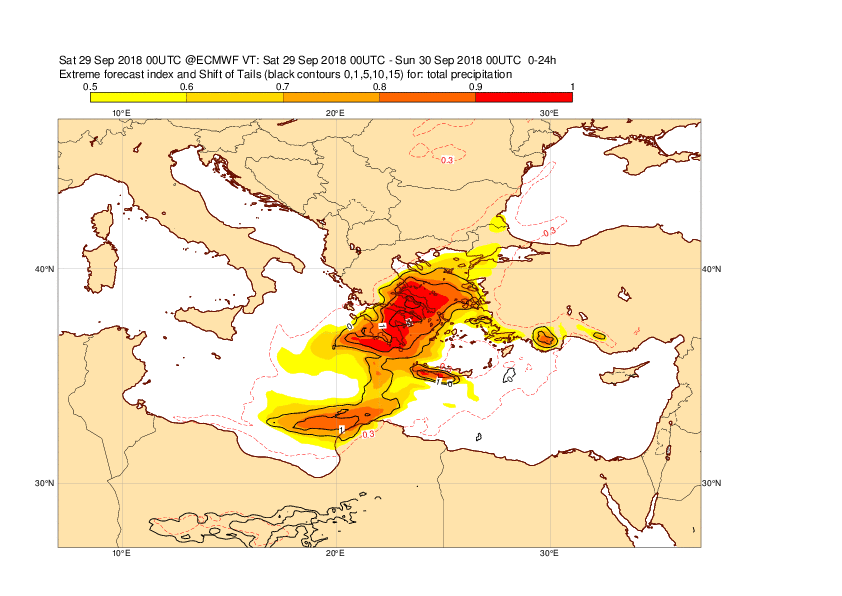
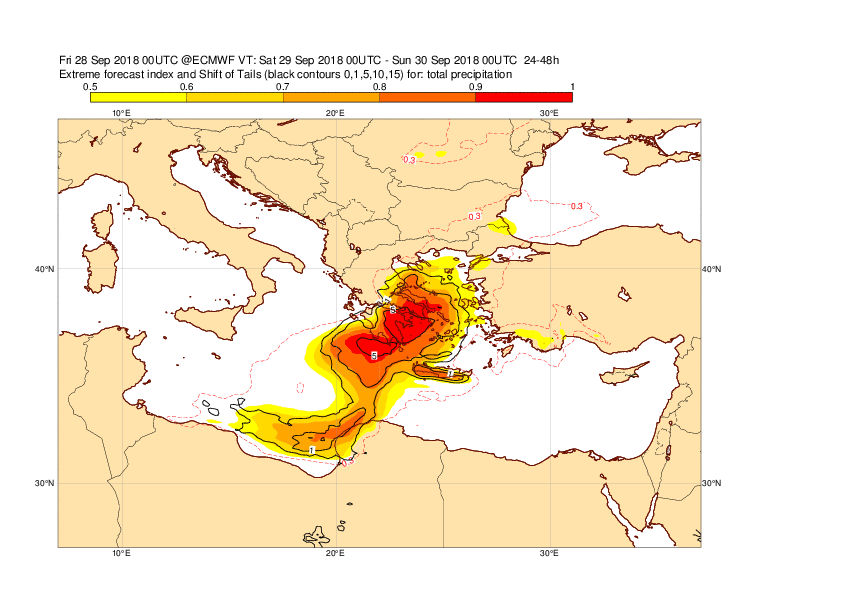
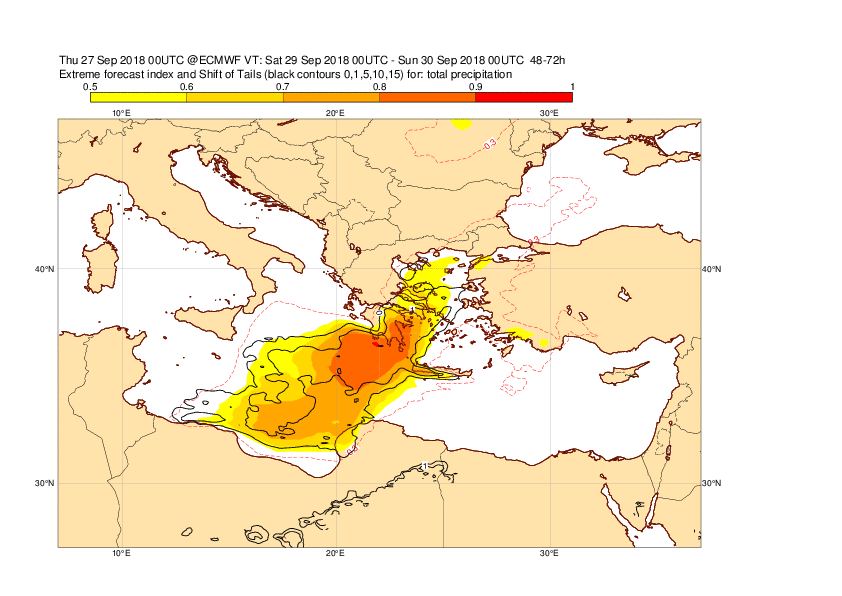
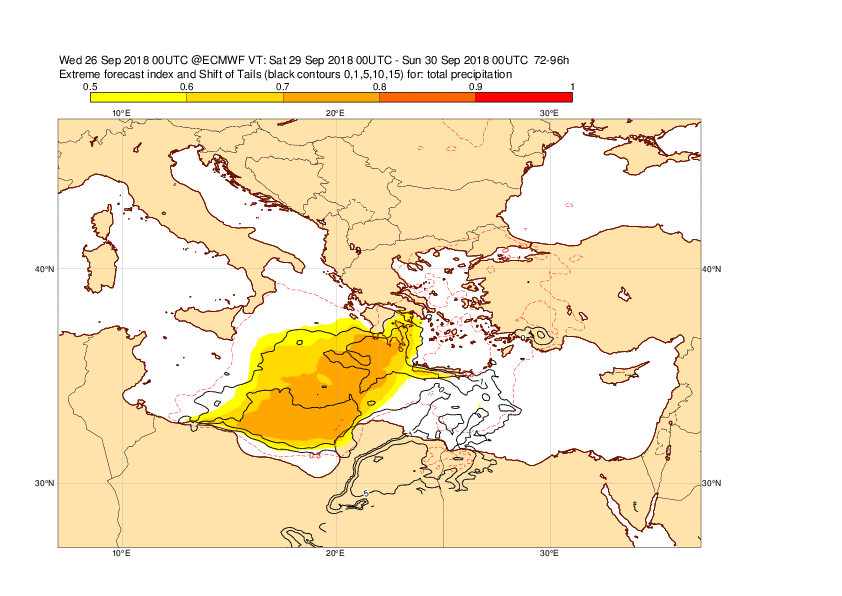
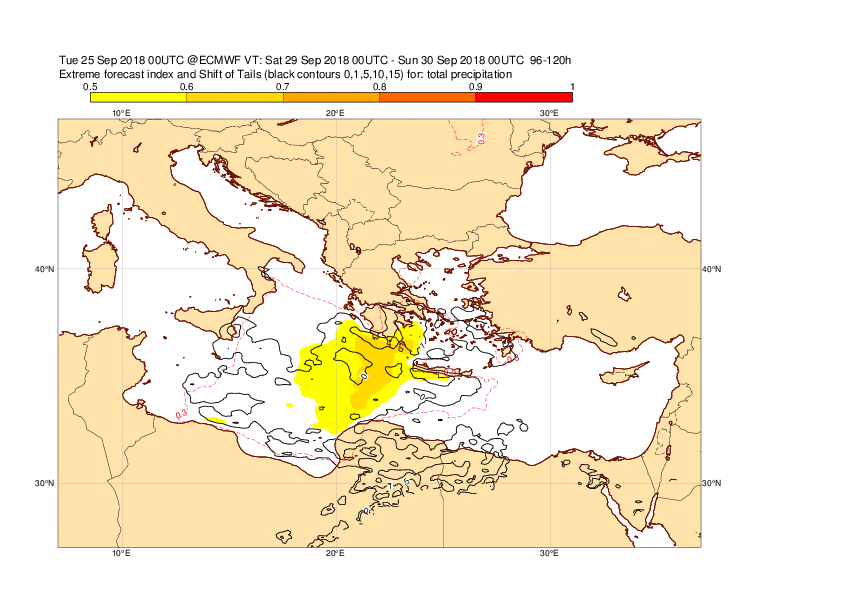
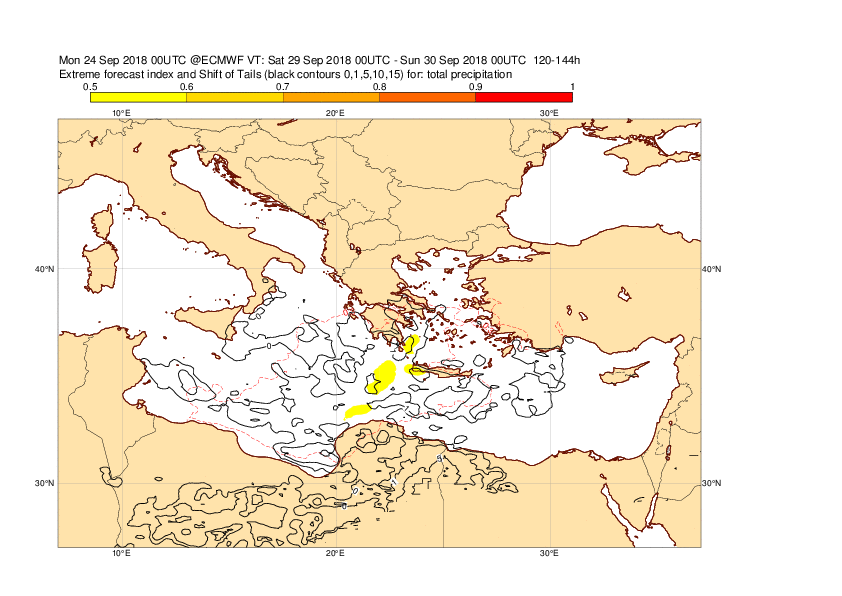
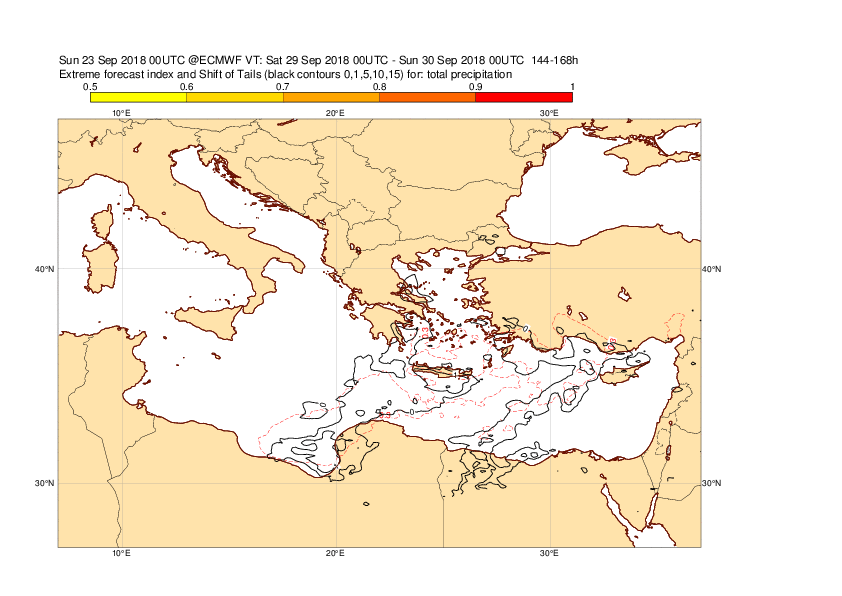
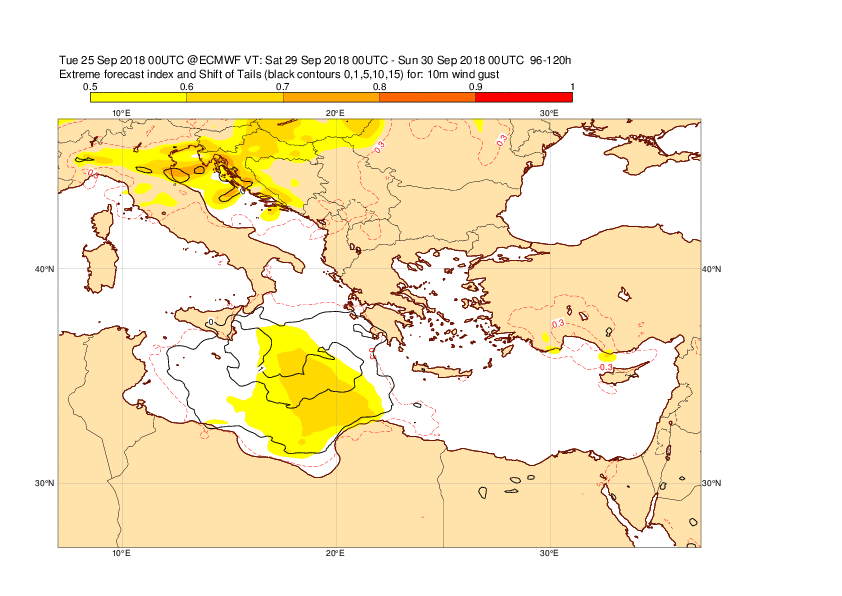
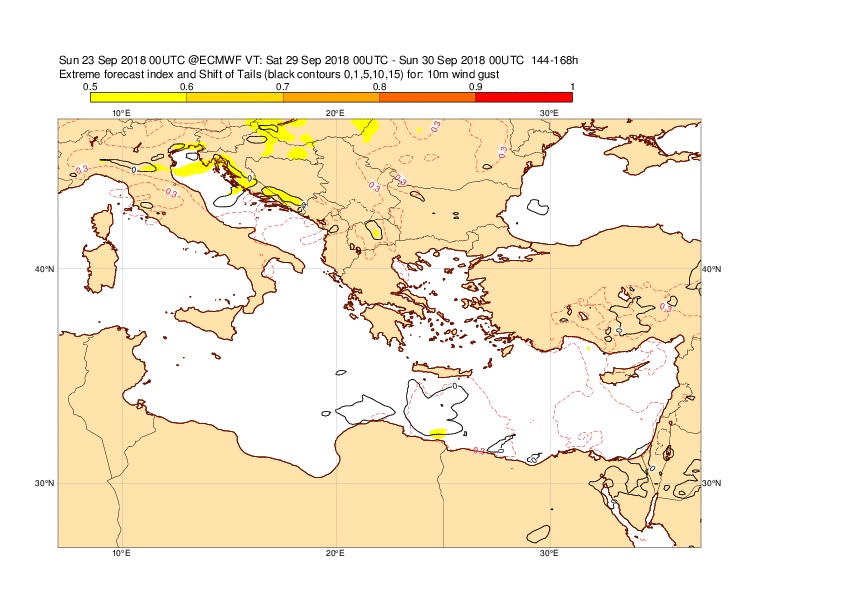
The plots below show EFI and SOT for 24-hour precipitation (29 September).
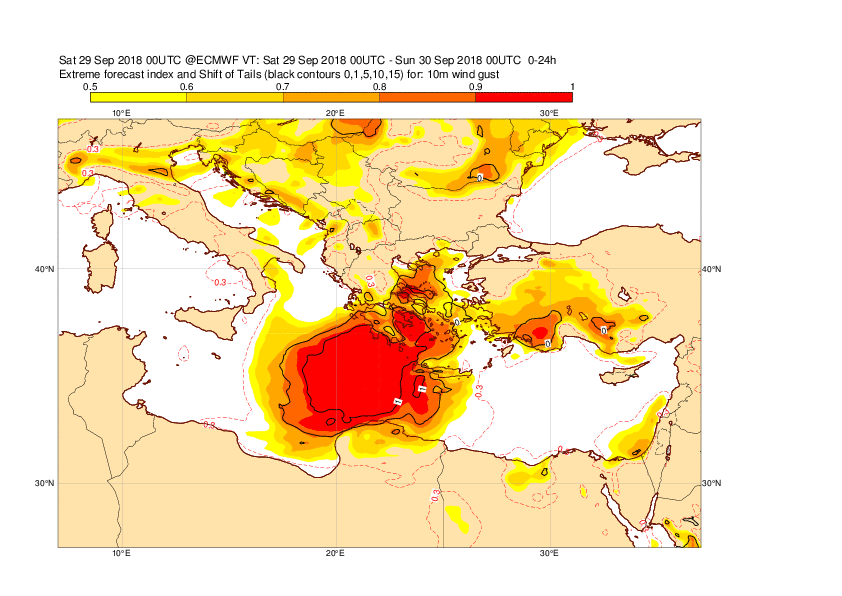
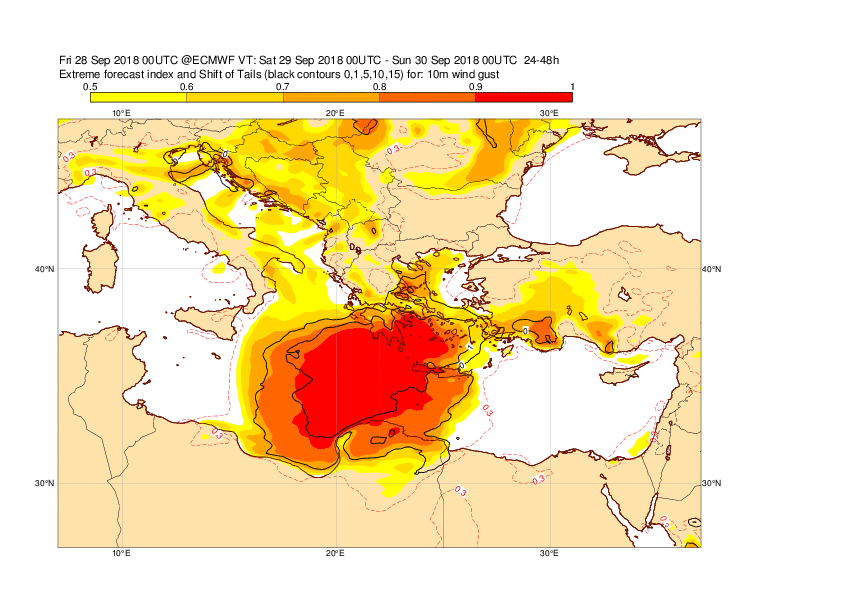
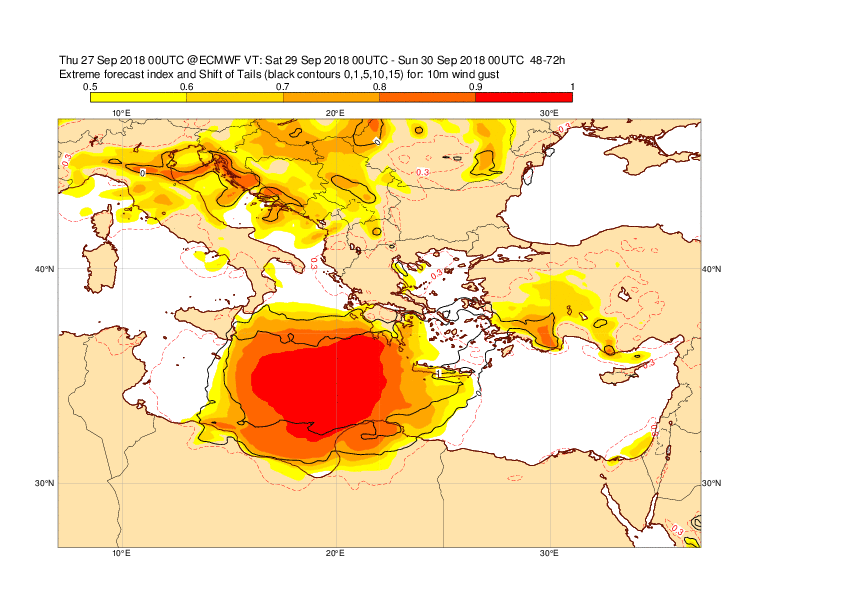
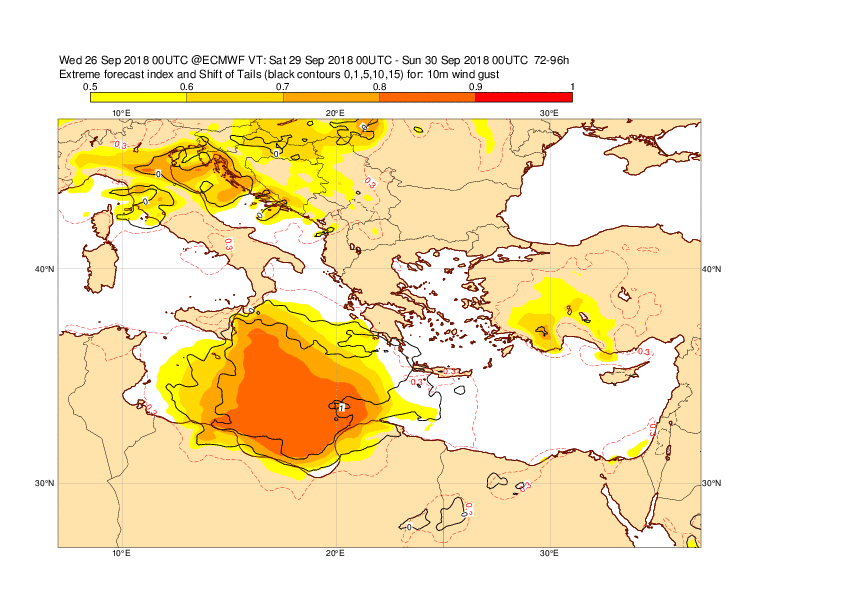
The plots below show EFI and SOT for 24-hour maximum wind gusts valid 29 September.
3.4 Monthly forecasts
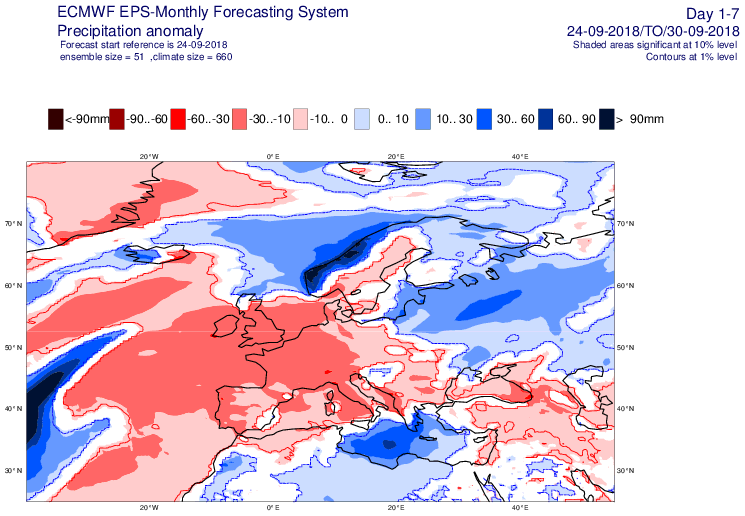
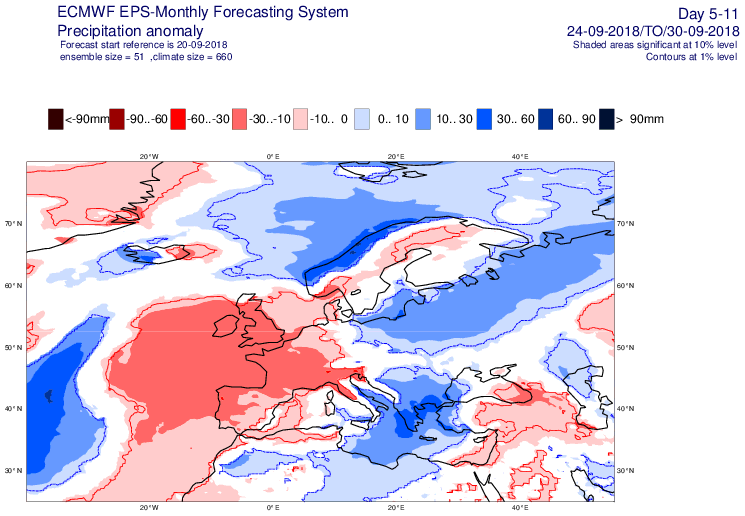
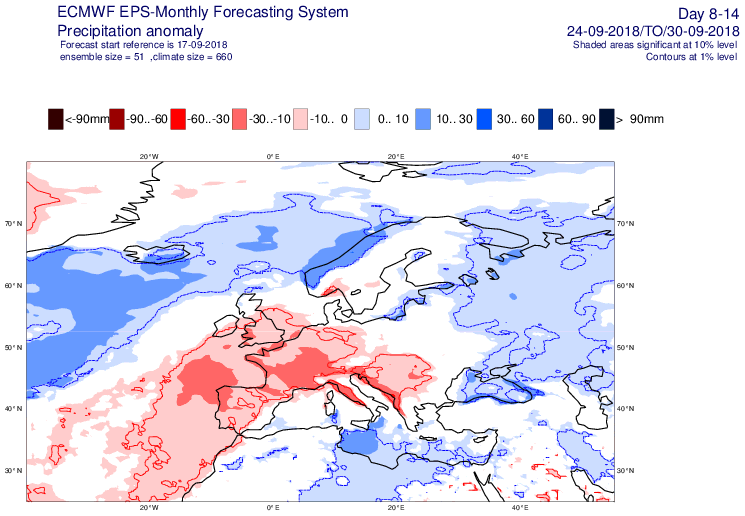
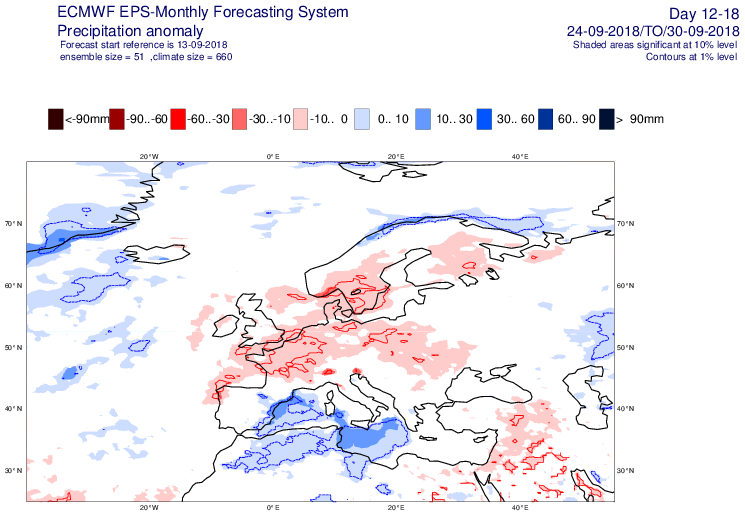
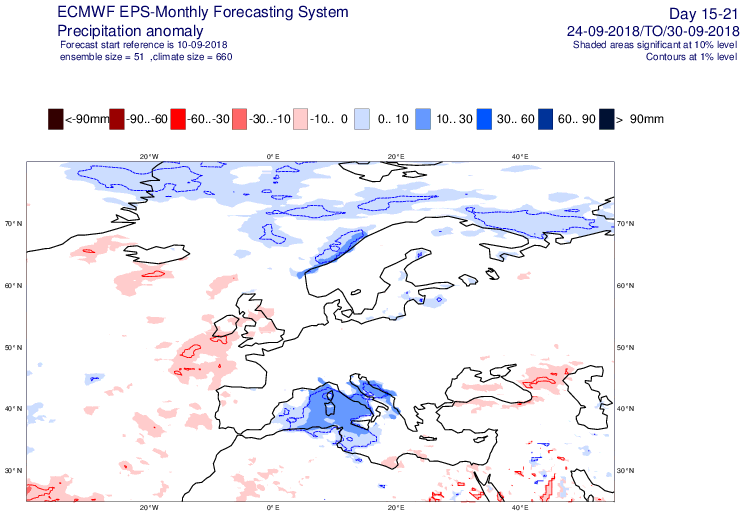
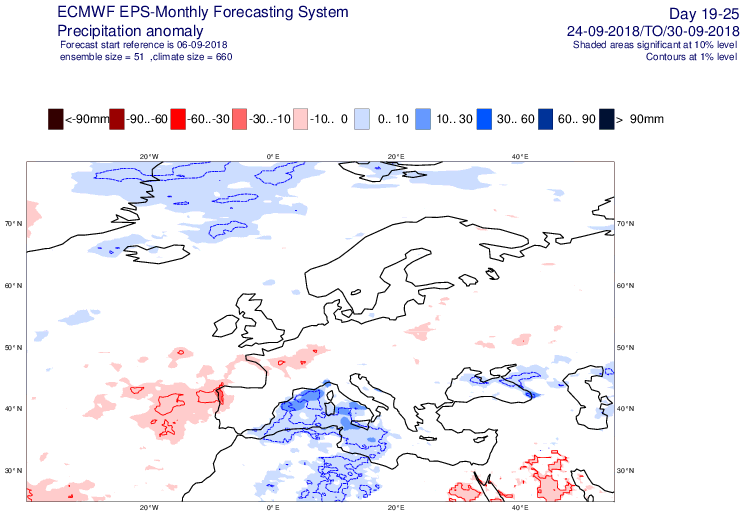
The plots below show the weekly anomalies (24-30 September) of precipitation from extended-range forecasts.
3.5 Comparison with other centres
3.6 EFAS
Some indication of potential severe floods in the south of Greece was picked up by EFAS sysetm. Also some chance for flash flood was present. It is difficult to judge how was the observed extent of the river floods and flash floods. Possibly EFAS was underestimating them. In the 28th 00z run some rivers on the Peloponnese got flared up (blueish coloured river sections), and also there were flash flood alert points (more in the 12z runs as the snapshot is showed for) in the model.
4. Experience from general performance/other cases
5. Good and bad aspects of the forecasts for the event
- Unusually large differences between DA and LWDA analyses in the vicinity of the incipient cyclone near Libya => late data impact
- IFS probably the first, of the international models, to forecast the genesis of this cyclone
- Some early HRES forecasts were too intense, giving medicanes much deeper than had ever occurred before in the Mediterranean (though not necessarily impossible, theory suggest that a level equivalent to CAT 1 hurricane is possible for a medicane)
- ENS and HRES exhibited similar track errors in the medium range - mostly the tracks were a bit too far south - e.g. near to or just N of Crete
- Ppn forecasts in the medium range were "contaminated" by track errors
- IFS analyses of the system near to Greece were poor, central mslp values ~10-15mb too high. Likewise the core of strong gradients and strong surface winds was notably missing in these analyses
- Better analyses could in principal have been realised by better use of high density scatterometer data. It is probably the data thinning that stops us realising this benefit (though that may have other associated problems).
