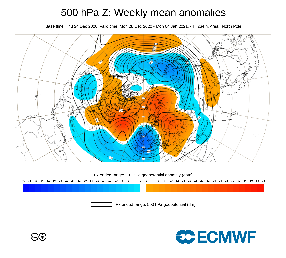
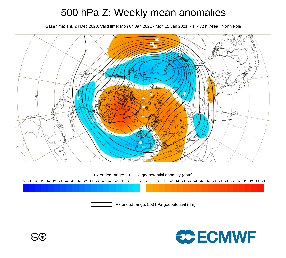
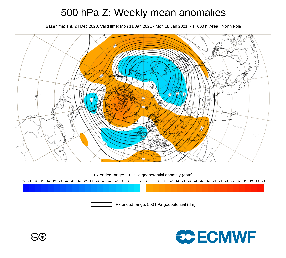
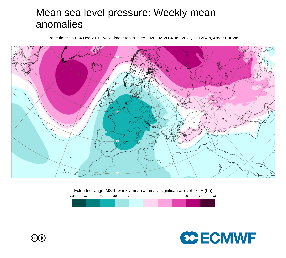
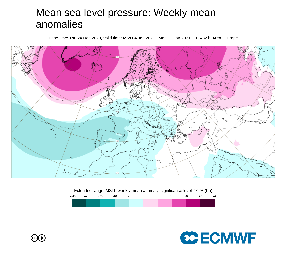
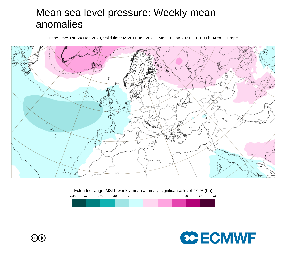
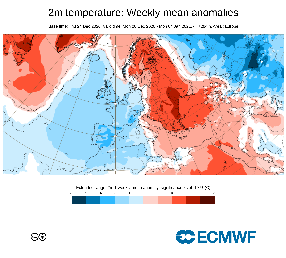
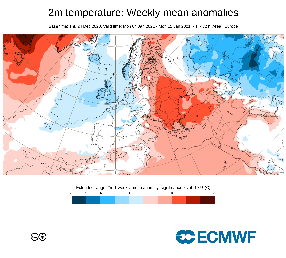
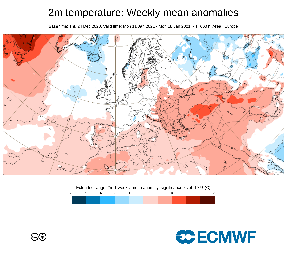
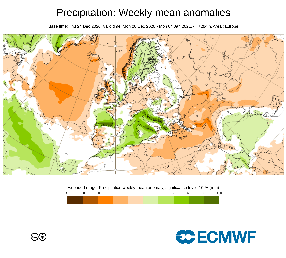
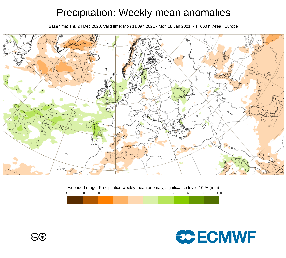
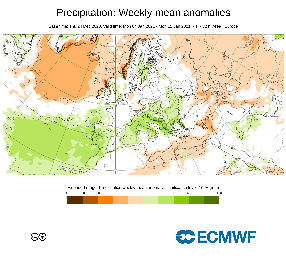
Ensemble mean weekly anomalies
Forecast User Guide: Graphical Output
z500 (North Pole projection)
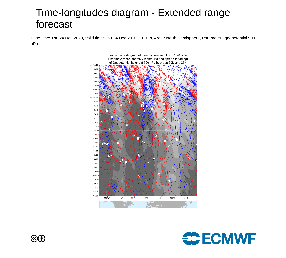
z500 Howmoller diagram
Forecast User Guide: Graphical Output
Mean-sea-level pressure
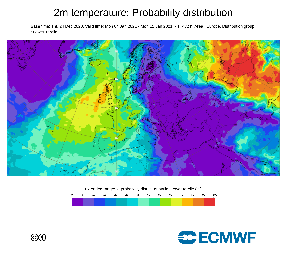
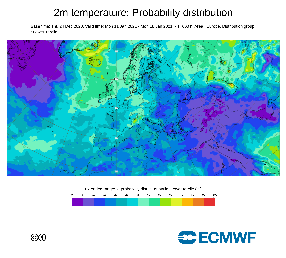
2-metre temperature
Total precipitation
Probability products
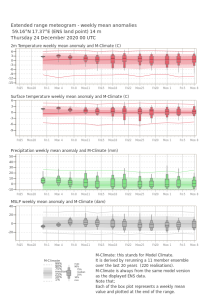
Extended-range metgram
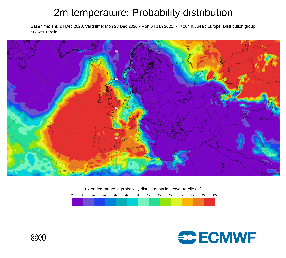
Probability for lower tercile for 2-metre temperature
Forecast User Guide: Graphical Output
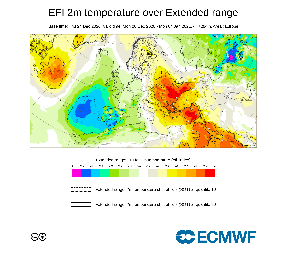
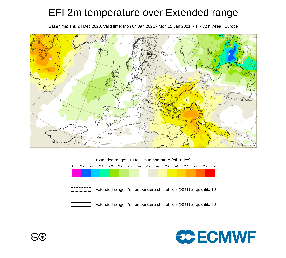
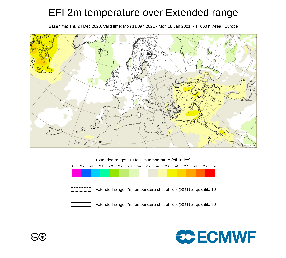
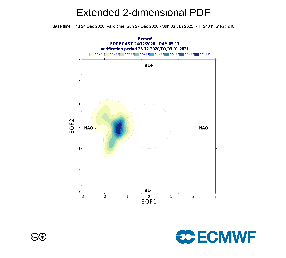
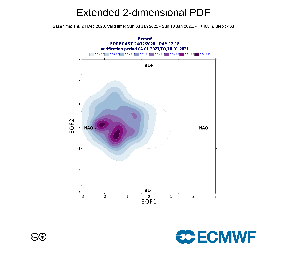
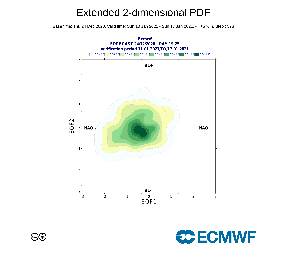
Extended-range EFI and SOT for 2-metre temperature
Forecast User Guide: Extended Range - CDFs, EFI and SOT
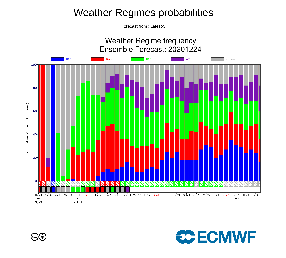
Regime products
Forecast User Guide: Extended Range Regime Charts
For discussion around the utility and verification, see: https://www.ecmwf.int/en/newsletter/158/meteorology/new-product-flag-risk-cold-spells-europe-weeks-ahead
Extended Range Two-dimensional Regime diagram
Extended Range Weather Regime Frequency histogram

Composites of 2-metre temperature for the 4 Euro-Atlantic regimes
NAO+, Scandinavian Blocking, NAO-, Atlantic Ridge
Drivers of predictability
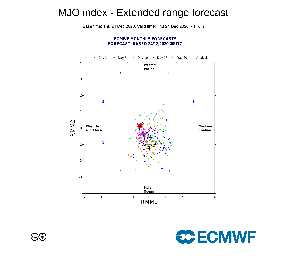
Madden-Julian oscillation (MJO) index
Forecast User Guide: Madden-Julian Oscillation Output
Wheeler-Hendon MJO diagram
Teleconnection patterns from MJO in ERA-Interim (lag 10 days)
After phase 3 (left) and phase 6 (right)
Sudden Stratospheric Warmings (SSW)
Composites of weak and strong Polar Vortex (from Baldwin and Dunkerton, 2001):
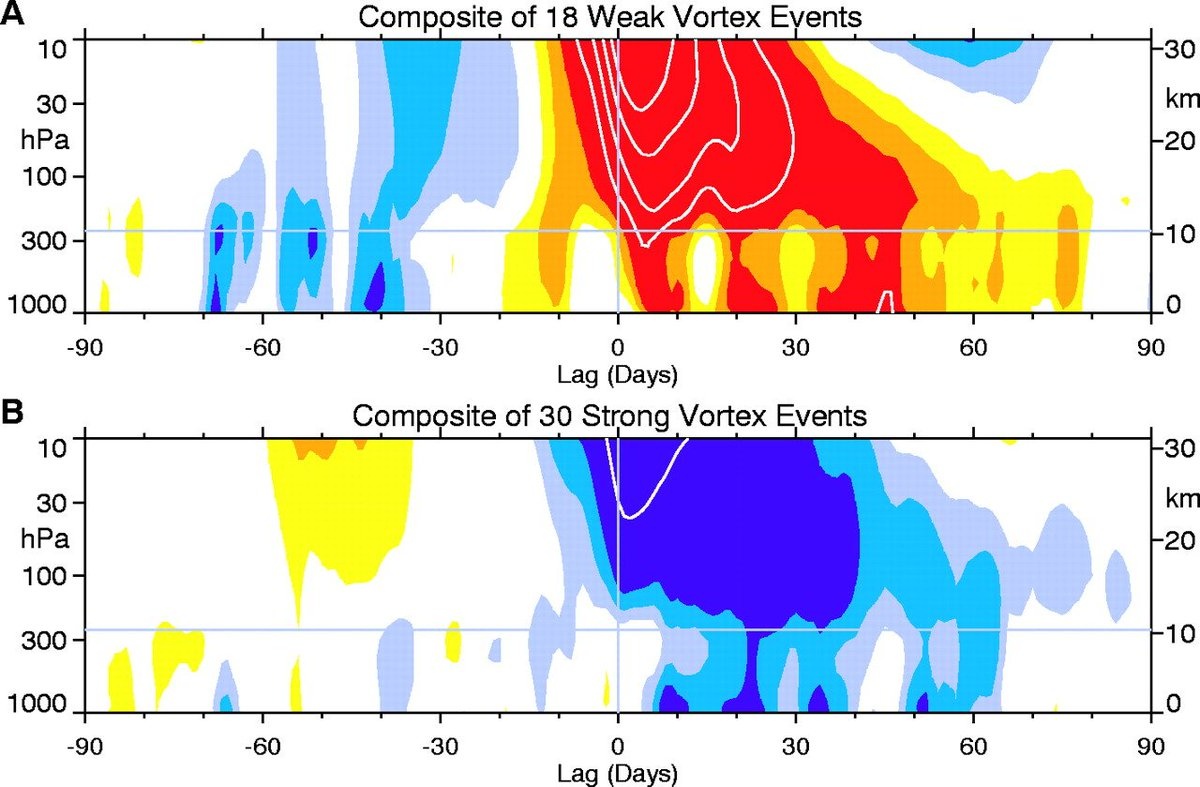
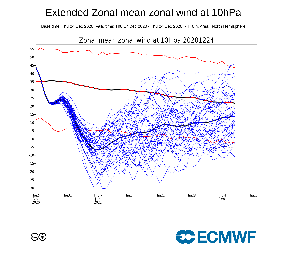
Plume of 10hPa zonal wind at 60N
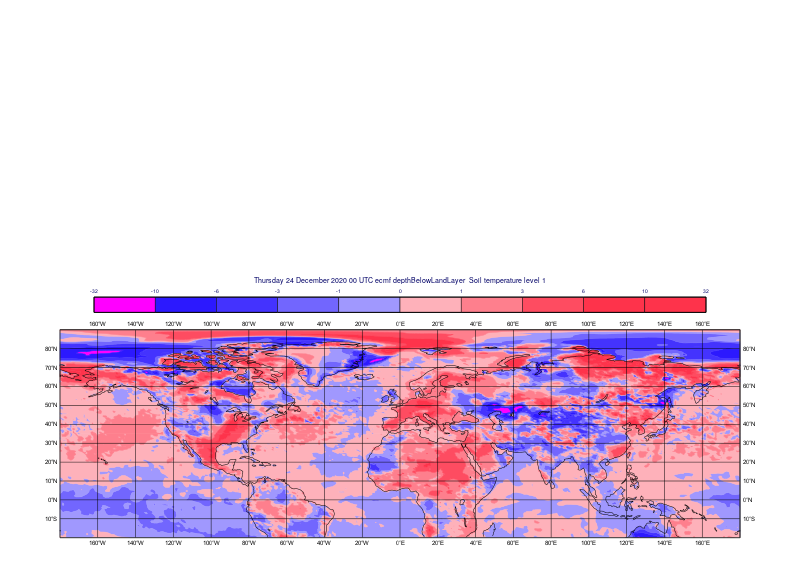
Initial anomalies for SST/soil temperature