Versions Compared

Key

  • This line was added.
  • This line was removed.
  • Formatting was changed.
Panel
titleVisualising ODB in Magics

There are several ways on visualisating ODB data in Magics.

  • use the ODB Magics objects. This allows Magics to read a odb file and extract some columns for geographical plots or graph.
  • In python, it also possible to use odb_api packages to create a numpy array and pass the values in memeoty to Magics. magics is then able to perform symbol plotting on a geographical area, time series, etc .. 

This page will present examples of these different plottings, and will offer skeletons of python programs.


Table of Contents

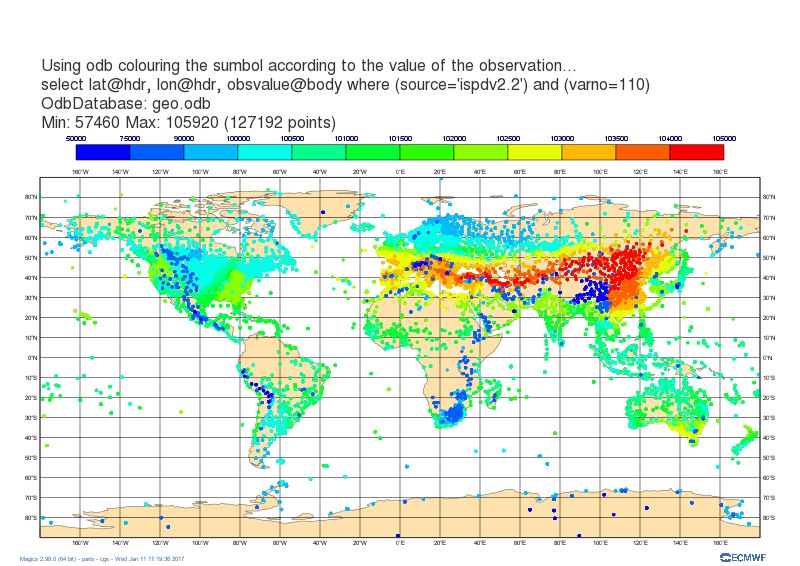
Using an ODB file and create a geographical map

...

Section
Column
width350px

Column
width70%
Code Block
languagepy
titleAdvanced symbol plotting
collapsetrue
# importing Magics module
from Magics.macro import *

# Setting of the output file name
output = output(output_formats=['png'],
                output_name_first_page_number='off',
                output_name='odb_step2')

# Background Coastlines
background = mcoast(
    map_coastline_sea_shade_colour='white',
    map_coastline_land_shade_colour='cream',
    map_grid='on',
    map_coastline_land_shade='on',
    map_coastline_sea_shade='on',
    map_label='on',
    map_coastline_colour='tan',
    )

# Import odb data
odb = odb_geopoints(odb_filename='geo.odb',
                    odb_latitude_variable='lat@hdr',
                    odb_longitude_variable='lon@hdr',
                    odb_value_variable='obsvalue@body',
                    )

# Define the symbol plotting
symbol = msymb(symbol_type='marker',
               symbol_colour='navy',
               symbol_advanced_table_selection_type='list',
               symbol_advanced_table_level_list=[50000., 75000., 90000., 100000., 
							100500., 101000., 101500., 102000., 102500., 103000., 
							103500., 104000., 105000.],
               symbol_advanced_table_min_level_colour='blue',
               symbol_advanced_table_max_level_colour='red',
               symbol_advanced_table_colour_direction='clockwise',
               symbol_table_mode='advanced',
               legend='on'
               )
#Adding some text
lines = ['Using odb colouring the sumbol according to the value of the observation...', 
         'select lat@hdr, lon@hdr, obsvalue@body where (source='ispdv2.2') and (varno=110),]

title = mtext(
    text_lines=lines,
    text_html='true',
    text_justification='left',
    text_font_size=0.7,
    text_colour='charcoal',
    )

#adding some legend
legend = mlegend(legend='on', legend_text_colour='navy',
                 legend_display_type='continuous')


#Create the plot
plot(output, background, odb, symbol, title,legend)

Create a time series


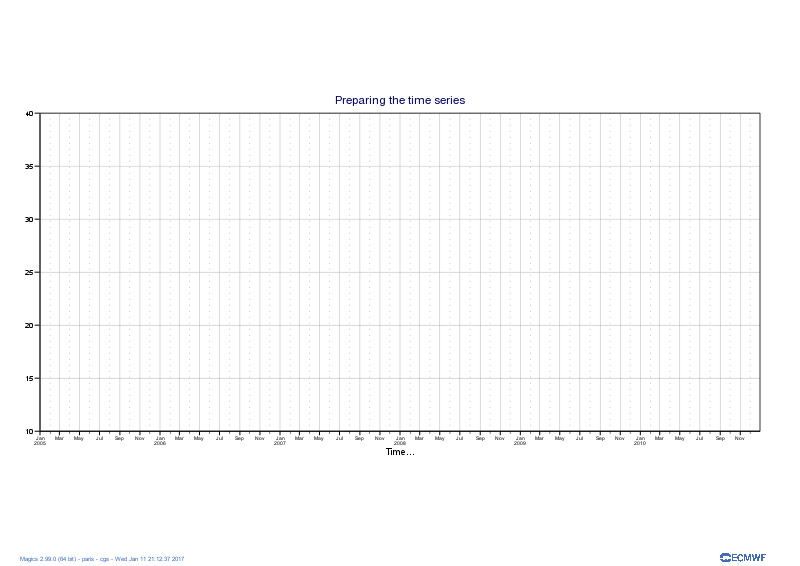
In this example, we will first setup a cartesian projection for the time series: the x axis will show the date from January 2005 to December 2010, and the y axis will represent the number of observation for each day, i.e. a range from 0 to 1000. 

This plot needs the creation of 3 Magics objects a magics.mmap to describe the projection and 2 axis to specify labels, ticks and other attributes. 

The plot command will create a png repenting the projection and the 2 axis. 


Section
Section
Column
width350px

Image RemovedImage Added

Column
width70%
Code Block
languagepy
titleAdvanced symbol plotting
collapsetrue
# importing Magics module
fromimport Magics.macro importas *magics


# Setting of the output file name
output = magics.output(output_formats=['png'],
                output_name_first_page_number='off',
                output_name='odb_step2graph1')


# Define the Backgroundcartesian Coastlinesprojection
backgroundmap = mcoast(magics.mmap(subpage_map_projection = "cartesian",
    map_coastline_sea_shade_colour='white              subpage_x_axis_type = 'date',
    map_coastline_land_shade_colour='cream',
      map_grid='on',
    map_coastline_land_shade='on',
    mapsubpage_coastliney_seaaxis_shadetype = 'onregular',
       map_label='on',
    map_coastline_colour='tan',
    )

# Import odb data
odb subpage_x_date_min = odb_geopoints(odb_filename='geo.odb'2005-01-01',
                    odb_latitude_variable='lat@hdrsubpage_x_date_max = '2010-12-31',
                    odbsubpage_longitudey_variable='lon@hdr'min = 0.,
                    odbsubpage_valuey_variable='obsvalue@body'max = 1000.,
                  subpage_y_position = 5.)

# Define#define the symbol plotting
symbolaxis
horizontal_axis = msymbmagics.maxis(symbolaxis_type='marker',
orientation = "horizontal",
                         symbol_colour='navy      axis_type = 'date',
               symbol_advanced_table_selection_type='list'                axis_date_type = "automatic",
               symbol_advanced_table_level_list=[50000., 75000., 90000., 100000., 
							100500., 101000., 101500., 102000., 102500., 103000., 
							103500., 104000., 105000.],
                axis_grid = "on",
                               axis_grid_line_style = "solid",
                               axis_grid_thickness = 1,
                               axis_grid_colour = "grey",
                               axis_minor_tick ='on',
                               axis_minor_grid ='on',
                               axis_minor_grid_line_style = "dot",
                               axis_minor_grid_colour = "grey",
                               axis_title = 'on',
                               axis_title_text = "Time...",

                               symbol_advanced_table_min_level_colour='blue')
vertical_axis = magics.maxis(axis_orientation = "vertical",
               symbol_advanced_table_max_level_colour='red',
               symbol_advanced_table_colour_direction='clockwise',
 axis_grid = "on",
                symbol_table_mode='advanced',
               legend='on'axis_grid_line_style = "solid",
               )
#Adding some text
lines = ['Using odb colouring the sumbol according to the value of the observation...', 
 axis_grid_thickness = 1,
      'select lat@hdr, lon@hdr, obsvalue@body where (source='ispdv2.2') and (varno=110),]

title = mtext(
    text_lines=lines,
    text_html='true',
    text_justification='left',
    textaxis_fontgrid_size=0.7colour = "grey",
      text_colour='charcoal',
    )

#adding some legend
legend = mlegend(legend='on', legend_text_colour='navy',
             )
#Add a text
title = legend_display_type='continuous')


#Createmagics.mtext(text_lines=['Preparing the time series'])

# Execute the plot.
magics.plot(output, backgroundmap, odbhorizontal_axis, symbolvertical_axis, title,legend)