Status:Ongoing analysis Material from: Linus
Discussed in the following Daily reports:
Picture
1. Impact
2. Description of the event
http://floodobservatory.colorado.edu/Version3/2014Pakistan4179.html
Dail accumulated precipitation
There are no images attached to this page.
The figure above shows the 3-day accumulation of precipitation between 3 September 00UTC and 6 September 00UTC. In the border between Pakistan and India two stations reported more than 300 mm.
3. Predictability
3.1 Data assimilation
3.2 HRES
Accumulated precipitation from HRES for 3-6 September
There are no images attached to this page.
The plots above shows the accumulated precipitation in HRES between 3-6 September (72 hours).
3.3 ENS
3.4 Monthly forecasts
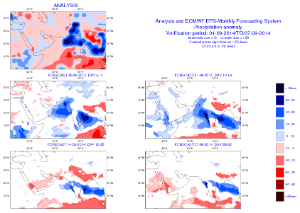
The figure above shows the ensemble mean anomalies for the week 1-7 September from different monthly forecasts, including the analysis (top panel).
3.5 Comparison with other centres
4. Experience from general performance/other cases

