Objectives
- Set-Up a cartesian projection
- Learn how to pass arrays as input of curves
- Learn how to use CSV files as input of curves
- Add a text.
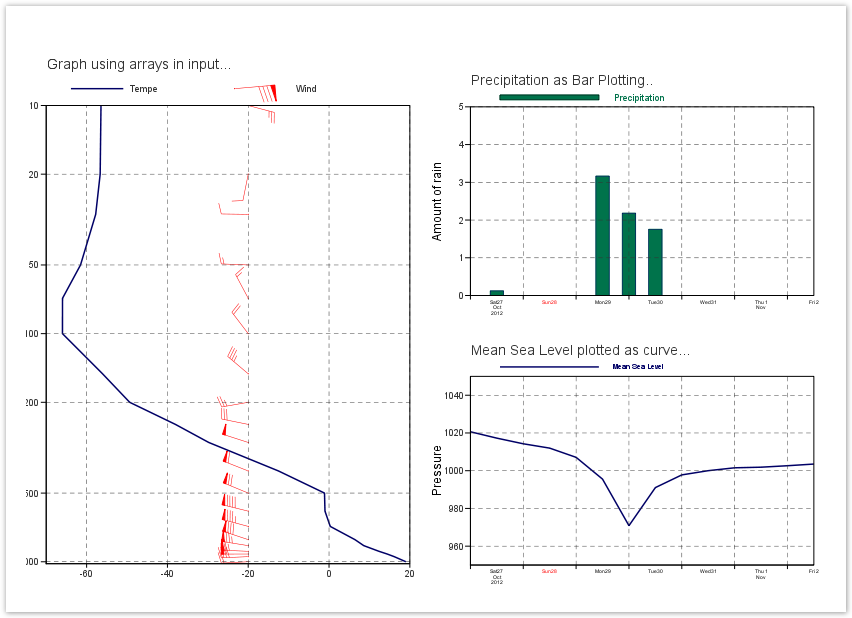
- Create a layout
You will need to download
- The CSV file containing the MSL time series
- And at the end only
 , the solutions for
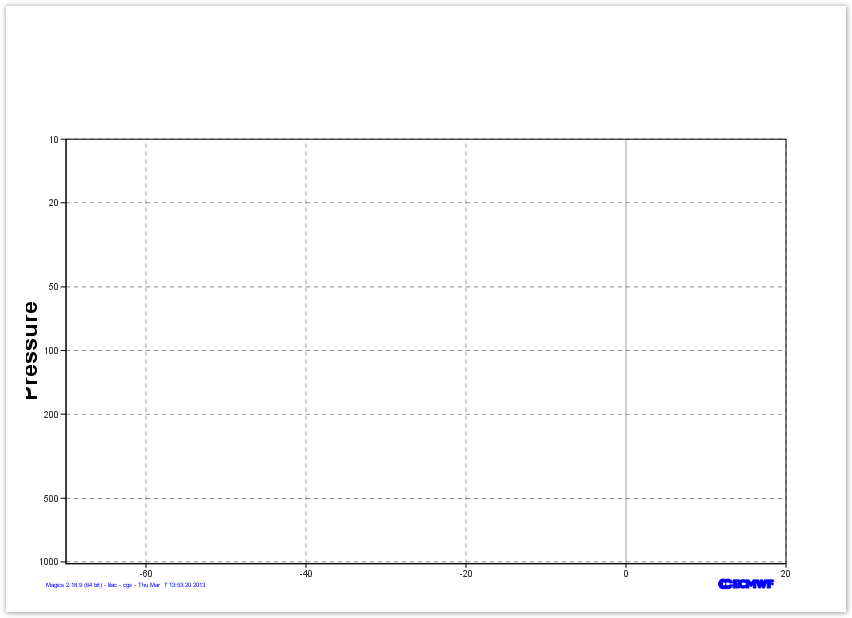
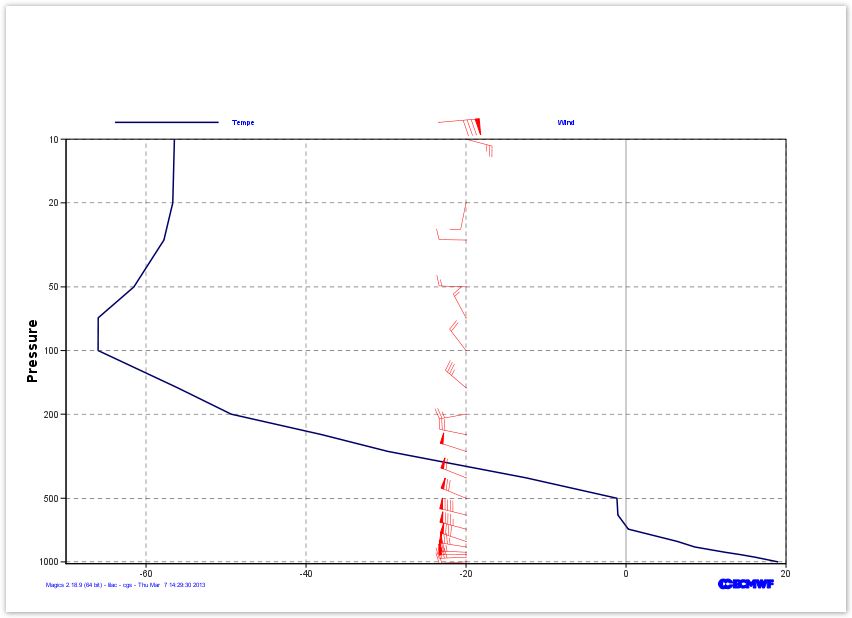
Profile: create the Cartesian Projection
For our vertical profile, we will need :
- a horizontal regular axis for a temperature range going from -60oC to 20oC.
- a vertical logarithmic axis going from 1020 hPa to 10 hPa
Have a look at the Subpage Documentation and at the Axis Plotting Documentation, and try to get the 0oC grid line highlighted.
Parameters to check
| Useful projection parameters |
|---|
subpage_map_projection |
| subpage_x_axis_type |
| subpage_y_axis_type |
| subpage_x_min |
| subpage_y_min |
| subpage_x_max |
| subpage_y_max |
| Useful axis parameters |
|---|
| axis_orientation |
| axis_type |
| axis_grid |
axis_grid_reference |
| axis_title |
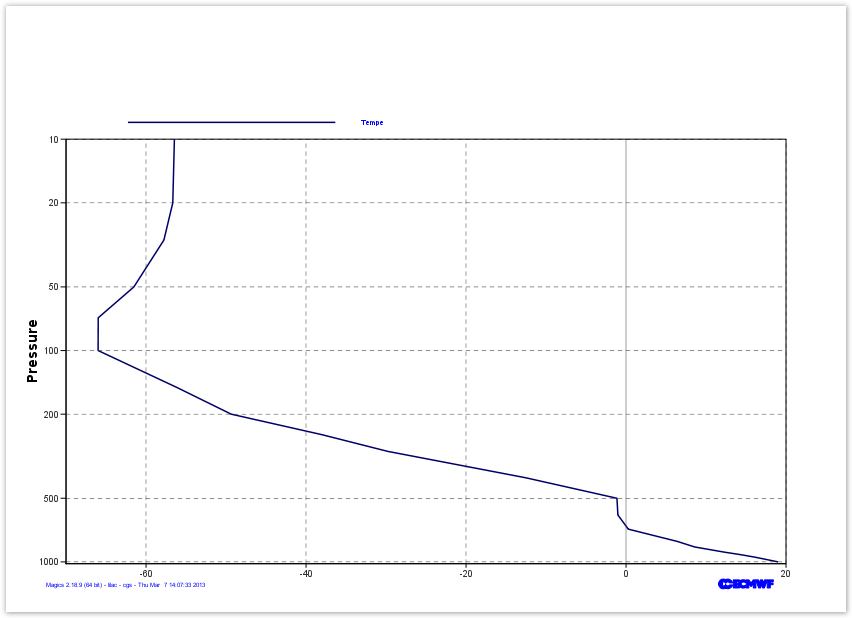
Profile: Using Arrays as Input of a Graph
Here is the list of levels, and the list of Temperature in Kelvin at each levels.
levels = [1.,2.,3,5,7,10,20,30,50,70,100,150,200,250,300,400,500,600,700,800,850,900,925,950,1000]
kelvin = ([263.118652344,254.822738647,242.517868042,223.301025391,219.254943848,216.710174561,216.507095337, 215.398986816,211.643295288,207.18812561,207.172134399,217.097396851,223.809326172,235.13168335,243.377059937,260.635147095,272.02935791,272.145584106,273.448501587,279.562927246,281.745040894,285.503082275,287.543685913,289.284072876,292.170974731]
We can pass these arrays to Magics using the minput object . Check the Input Data Documentation for more information about the parameters. Note that we want to use Celsius in our graph...
The mgraph object can then be used to preform the visualisation. All the parameters can be found in the Graph Plotting Page.
Parameters to check
| Useful input parameters |
|---|
input_x_values |
| input_y_values |
| Useful graph parameters |
|---|
| graph_line_colour |
| graph_line_thickness |
Profile: Using Arrays as Input for wind Plotting
Here is the list of pressure levels, and the list of u and v components for each pressure level.
levels = [1.,2.,3,5,7,10,20,30,50,70,100,150,200,250,300,400,500,600,700,800,850,900,925,950,1000]
u_component = [77.815612793,63.232711792,44.9090881348,28.2789916992,17.401763916,
11.8307037354,-0.725036621094,-4.75889587402,-7.83796691895,-3.76489257812,
-6.18388366699,-13.1139526367,-13.05027771,-15.1851959229,-23.5844726562,
-27.866394043,-33.0458984375,-45.8946380615,-41.540222168,-39.6210327148,
-37.6231689453,-32.947265625,-29.4743499756,-22.0828552246,-10.0008392334]
v_component = [7.38911437988,5.23355102539,0.636322021484,-3.75567626953,
0.167388916016,-3.12893676758,-3.60003662109,0.0688171386719,
0.305236816406,7.06889343262,8.10516357422,11.1141815186,
-2.29931640625,3.08065795898,7.5965423584,11.0112915039,
13.6437530518,11.2753143311,11.1552124023,13.1494903564,
6.01538085938,1.37588500977,-0.0724334716797,-0.953598022461,-0.508377075195]
We can pass these arrays to Magics using the minput object . Check the Input Data Documentation for more information about the parameters.
We want to plot these winds as red falgs on the vertical of -20.
The mgraph object can then be used to preform the visualisation. All the parameters can be found in the Graph Plotting Page.
Do not forget the add a legend with a meaningful text!
Parameters to check
| Useful input parameters |
|---|
input_x_values |
| input_y_values |
| input_x_component_values |
| input_y_component_values |
| Useful graph parameters |
|---|
| graph_type |
| graph_flag_colour |
| graph_flag_length |
| legend |
| legend_user_text |
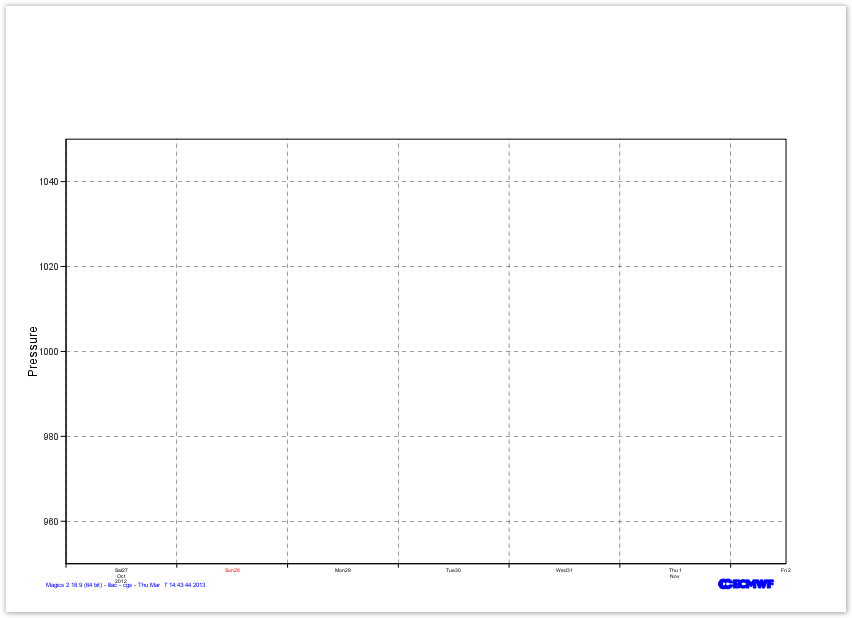
Time Series: Setting the Cartesian Projection for the Mean Sea Level Pressure time series
In this exercise, we will learn how to setup a date Coordinate, and browse the parameters available to style the style a date axis.
We want
- a horizontal date axis going from the 2012-10-27at 00:00:00 to 2012-11-02 12:00:00
- a vertical regular axis going from 950 hPa to 1005 hPa
Have a look at the Subpage Documentation and at the Axis Plotting Documentation,
Parameters to check
| Useful projection parameters |
|---|
subpage_map_projection |
| subpage_x_axis_type |
| subpage_y_axis_type |
| subpage_x_date_min |
| subpage_y_min |
| subpage_x_date_max |
| subpage_y_max |
| Useful axis parameters |
|---|
| axis_orientation |
| axis_type |