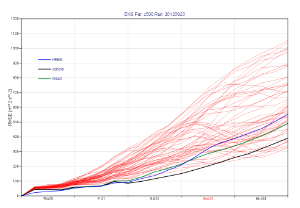
Plots from the Metview exercisesThe gallery below shows examples plots from all the practical exercises the participants were able to do with the Metview macros developed by Sandor Kertesz in ECMWF's forecast department. Most of the plot types can be animated with Metview. For more information, please contact: openifs-support@ecmwf.int.
|


