Status:Ongoing analysis Material from: Linus
Discussed in the following Daily reports:
Picture
Heavy monsoon rain during the first week of September led to flooding in north-eastern Pakistan, and has killed about 280 people.
Information about the event can be found here:
http://floodobservatory.colorado.edu/Version3/2014Pakistan4179.html
The plots above shows the observed 24-hour precipitation (symbols) day-by-day for the first week of September and short HRES forecast (36-60h). The major rainfall started on the 3 September and continued until 6 September. Please note that we currently missing observations from India.

The figure above shows the 3-day accumulation of precipitation between 3 September 00UTC and 6 September 00UTC. Close the border between Pakistan and India two stations reported more than 300 mm.
The plots above shows the accumulated precipitation in HRES accumulated for 3-6 September (72 hours).
The plots above shows the probability for more than 100 mm during the 72-hour period (3-6 September) from forecasts with different initial times.
The plots above shows the EFI and SOT for 3-day accumulation of precipitation.

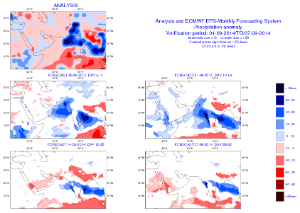
The figure above shows the ensemble mean anomalies for the week 1-7 September from different monthly forecasts, including the analysis (top panel).

The plot above is from Glofas from 6 September.
The plots above shows the discharge forecast for River Chenab at a point close to Multan.