
Vertical Profiles Window
Vertical Profiles Window supplements the tools already available (Probe, Time-series, Cities, EPSgram) on ecCharts and elsewhere. It provides information about the vertical structure of the forecast model atmosphere for any location (as selected by the Probe Tool) and any time (as selected by the Time Navigator). Currently validity times are limited to 6 hour steps up to T+120.
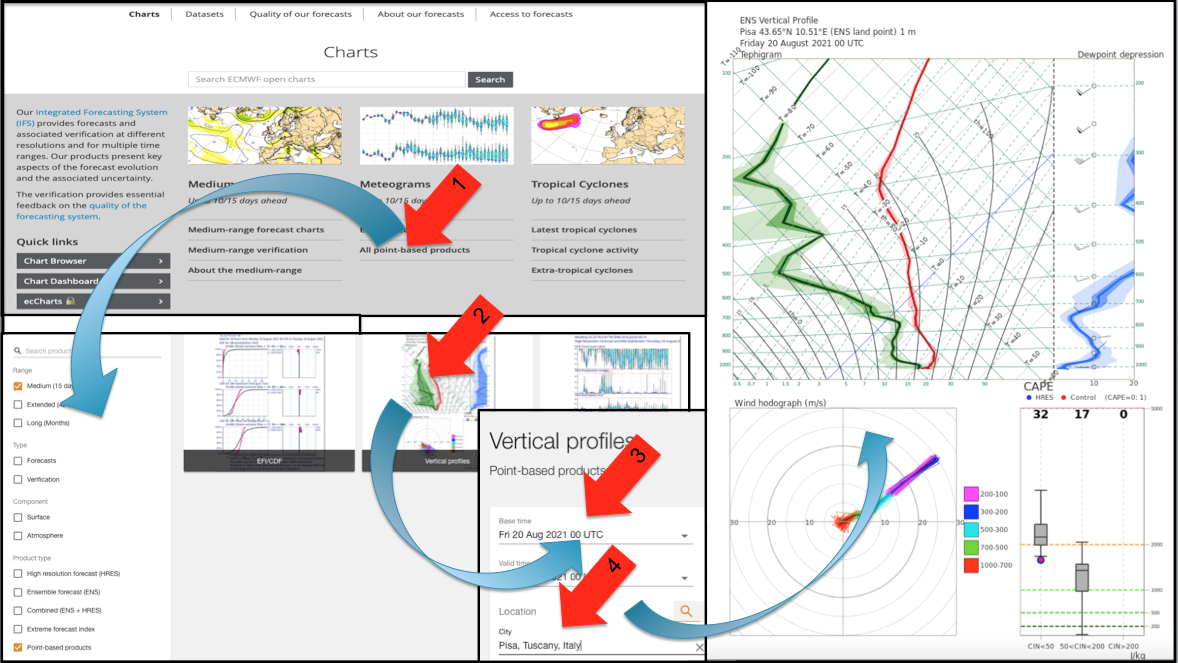
Fig8.1.8-1: To display Vertical Profile.
- From Charts menu, select All points based products.
- Select Medium Range and Point based products. Select Vertical Profiles icon.
- Select date/time of forecast base time and date/time of forecast valid time.
- Select location, either by name or by lat/long.
Vertical Profile display
A single display comprises the following elements:
Temperature, Dewpoint and Dewpoint Depression on (most) Model levels
- The vertical structure of temperature (red) and moisture (dewpoint, green) in tephigram format, and also dewpoint depression (blue). Shaded bands denote for the ENS the minimum, 25th and 75th percentiles and maximum for each of temperature, dewpoint and dewpoint depression distributions at each level, with the median value shown by a thin solid line. This display strategy mirrors the use of box-and-whisker plots on meteograms. A thick solid line represents HRES and a thick dashed line represents the Control (as on meteogram products).
- Dewpoint depressions are first computed from each ENS member output at each level, and then the spread and median are derived in the same way as for temperatures and dewpoint. So maximum dewpoint depression shown is not derived from the highest temperature on any ENS member and the lowest dewpoint on any ENS member at that level.
- Wind arrows from HRES standard level output are shown on the dewpoint depression diagram (5m/s per full barb). This plotting position was chosen for convenience, and not because of any direct or implied relationship with the dewpoint depression information itself.
- Note that whilst the Control and HRES traces for each thermal variable all represent plausible solutions, the same cannot be said for the median traces because they will very probably comprise data from different runs at different levels.
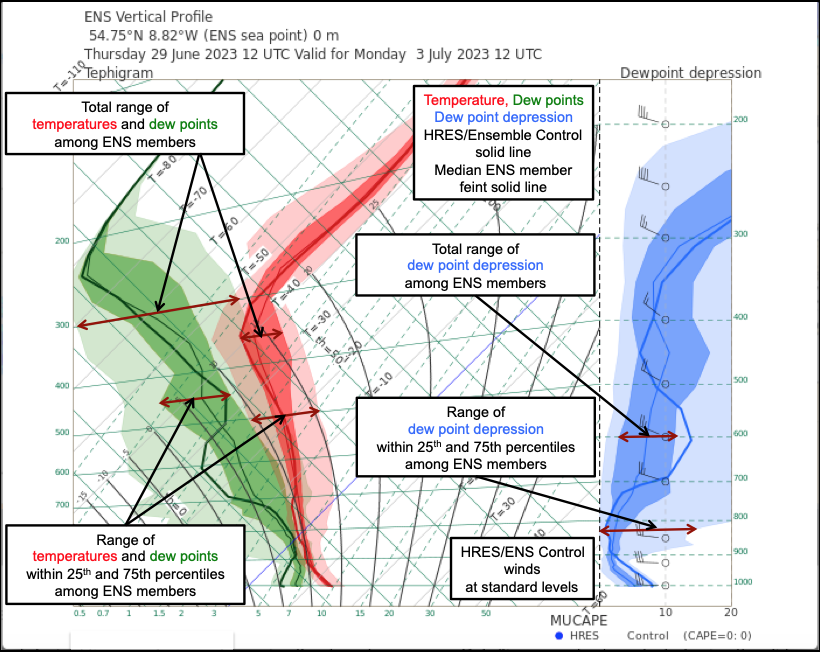
Fig8.1.8-2: An example of ecCharts vertical profile output.
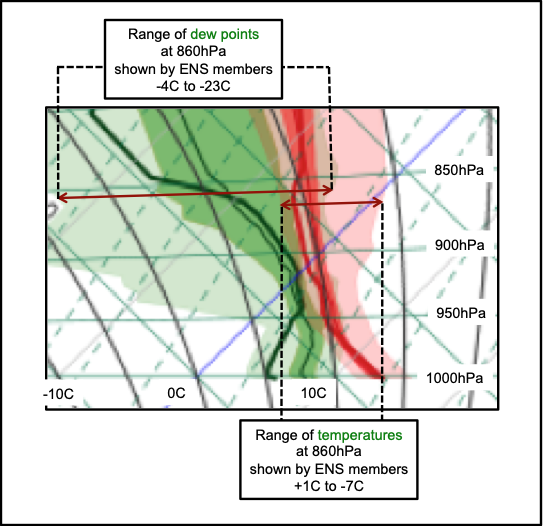
Fig8.1.8-3: Magnified portion of Fig8.1.8-2 showing the possible overlap between temperatures and dewpoints among the ENS members. At some levels (here 860hPa taken for illustration) some ENS members forecast dew points are higher than the temperature forecast by other ENS members. The dew point depression is 0C-20C, to enable the user to see moist environments in more detail.
The vertical profile uses every model level in the lower troposphere up to about 700mb, and every other level higher up than that is used to plot the vertical profiles. Before the spread metrics (e.g. 25th and 75th percentiles) are computed the model levels from each ENS member are all set to correspond the same (ensemble mean) pressure values.
Hodograph
Horizontal Winds on Pressure levels
- The vertical structure of winds (m/s) is shown by a wind hodograph that uses one line for each ENS member and one colour for each of a range of levels (warmer colours for low levels and colder ones for upper levels). Only data from standard pressure levels are shown. The radial wind speed scale varies to span the value range represented, with certain values (20, 50, 100 m/s) highlighted to aid quick interpretation. A solid line shows HRES/Ensemble control (which can be compared with, and should be identical to, HRES/Ensemble control winds on the dewpoint depression plot). To avoid plot clutter:
- the HRES/Ensemble Control run is shown in the same way as the other ENS members.
- the ENS median is not shown separately.
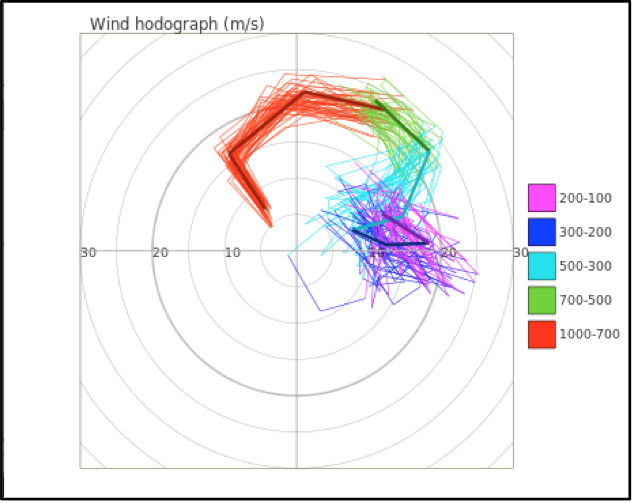
Fig8.1.8-4: An example of ENS and HRES winds plotted as hodographs. Depending on the case, these can be very informative (e.g. the consistency of significant shear among ENS members). This example shows significant shear from SE'ly winds at low levels to SW'ly winds at mid-tropospheric levels to W'ly winds in the upper troposphere.
CAPE and CIN diagram
The CAPE and CIN diagram shows the distribution of the most unstable Convective Available Potential Energy (CAPE) for three different categories of Convective Inhibition (CIN) in box and whisker format.
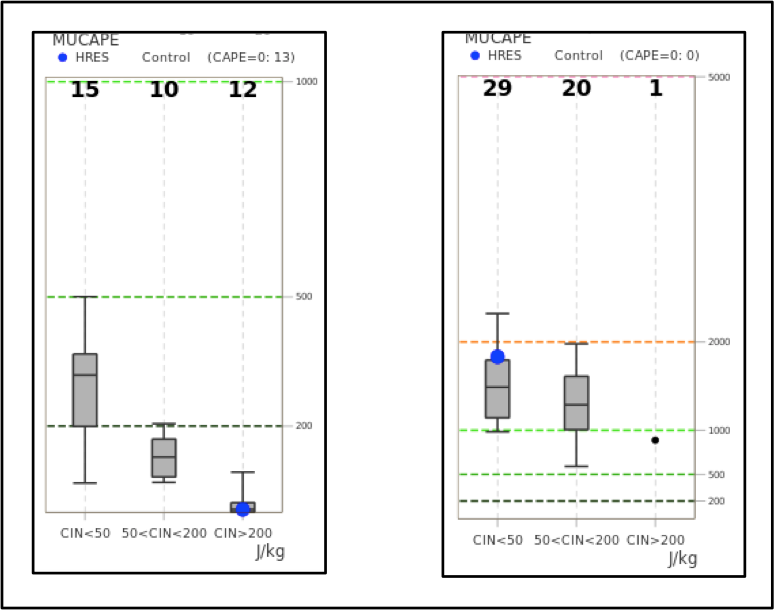
Fig8.1.8-5: An example of box and whisker plot of the distribution among ENS members of CIN and CAPE.
These diagrams indicate the variation among ENS members of the intensity of convection that may occur (CAPE) together with the likelihood of attaining the release of that convection (i.e. overcoming CIN). Three arbitrary ranges of CIN are shown: CIN <50J/kg representing a fairly low energy requirement before release of convection, CIN >200J/kg representing a more substantial energy requirement, and an intermediate value range of CIN. The vertical scale shows the CAPE energy in J/kg if convection is released. Box and whisker symbols have their normal meanings. Black filled circles are shown where there are 5 or fewer ENS members where convection is released. The numbers of ENS members within each CIN category are given at the top of each column. The number of members without release of CAPE is shown in the top right hand corner (e.g. CAPE=0: 13 meaning 13 ENS members failed to identify any CAPE in the forecast ENS ascent).
It should be remembered that the CIN and CAPE values indicated are diagnostic. The diagrams show the general state of the model atmosphere as forecast for that time. CIN does not indicate whether convective instability will be released, but rather provides an indication of the potential for that release. It is important the user to assesses the likelihood of CIN values being overcome during the following hours, either by diurnal heating, by dynamically induced uplift of the airmass, or by mechanical uplift caused by flow over mountains etc.
In principle, CIN, the convective inhibition, can be computed from any model level. In practice the temperature structure of the forecast atmosphere is scanned in the vertical, working out what CIN is for parcels rising from each level, and then the minimum of the values that correspond to levels in the lowest 350hPa of the atmosphere is stored in MARS (and used in ecCharts etc.). Conceptually, CIN is always zero or a positive value. However in practice where the parcel curve (from any of the levels tested) never even reaches the environment curve (i.e. it lies always to the left of it) then CIN is in effect infinite. Infinite values of CIN is stored as a missing value indicator whenever the (minimum) CIN encountered exceeds a pre-defined very large threshold (e.g. in strong inversions).
CAPE is different in that it is bounded between 0 and some large, non-infinite, value that depends on atmospheric structure. So CAPE is stored in a different manner that does not include missing values.
Example Vertical Profile Displays
Vertical Profile and ecCharts of CIN and CAPE

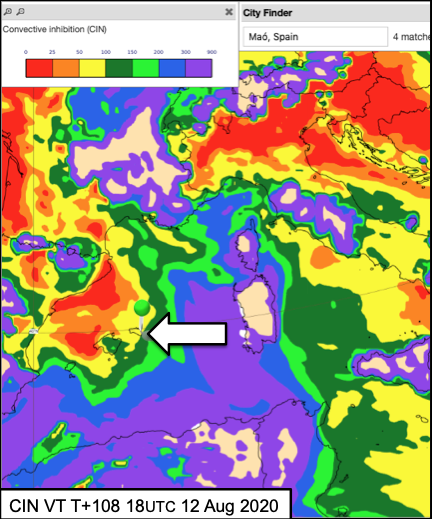
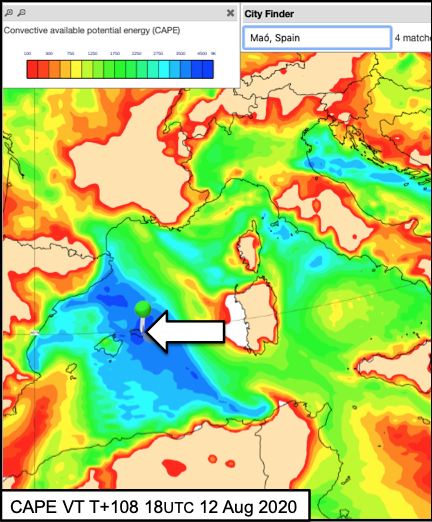
Fig8.1.8-6: Vertical profile at Mao (Mahon), Menorca, Spain (arrowed) with HRES CIN and CAPE, all from ecCharts: T+108 VT 18UTC 12 Aug 2020, DT 00UTC 8 Aug 2020.
In Fig8.1.8-6:
In the Vertical Profile:
- The spread of ENS temperatures is fairly large at this lead time and there are some differences in the detail near the inversion at around 950hPa.
- There are some very large differences among ENS members regarding forecast dewpoints, especially between 700hPa and 400hPa and this is reflected also in the wide spread of the dewpoint depression trace (from 0ºC to ≥20ºC).
- No information may be deduced regarding the temperature and dew points associated with each ENS member. In particular, at each level the values at the extremities of the dewpoint shading do not necessarily correspond to the extremities of the temperature shading (i.e. the highest temperatures are not associated with the higher dewpoints - indeed dewpoints on some ENS members are higher than the lowest temperatures on some other ENS members). The important information is the spread, or the uncertainty, of the ENS temperatures, dew points and dew point depressions.
The spread of temperature and/or dew point temperatures could be due to differences among the ENS models in:
- the evolution of the structure of the model airmass (e.g. differences in advection of model air masses).
- the timing of features (e.g. movement of a front past a given location).
- general differences in the synoptic scale evolution (given that this is T+108). This would have been a less likely reason at shorter leads.
On the CAPE diagram:
- 16 members need to overcome CIN of >200J/kg for CAPE to be released, and within this set the maximum CAPE is ~3000J/kg, the minimum is ~1800J/kg with the median value ~2700J/kg. Thus there is potential for very active free convection (high CAPE) but significant energy input is necessary to release it.
- 30 members need to overcome CIN of between 50J/kg and 200J/kg for CAPE to be released, and within this set the maximum CAPE is ~3500J/kg, the minimum is ~1900J/kg with the median value ~2900J/kg. Thus there is potential for active free convection (high CAPE) but only moderate energy input is necessary to release it.
- 4 members (2 have the same value) need to overcome CIN of <50J/kg for CAPE to be released, and within this set the maximum CAPE is ~2600J/kg, the minimum is ~1400J/kg (no mean value is given as there are ≤5 members). Thus active free convection (moderately high CAPE) is available with quite low energy input necessary to release it.
In general, there is no apparent relation between CIN and CAPE:
In this example:
- Where it is fairly easy to release free convection (i.e. a small amount of energy is needed - low CIN) it does not necessarily imply convection with large CAPE will follow.
- Where it is fairly difficult to release free convection (i.e. a large amount of energy is needed - high CIN) it does not necessarily imply convection with large CAPE will follow.
Other cases will of course have different characteristics.
Vertical Profile and ecChart of Probability of Convective Precipitation

Fig8.1.8-7: A forecast vertical profile for Premuda, Croatia T+90 VT 06UTC 18 Aug 2020, DT 00UTC 14 Aug 2020 . The corresponding ecChart shows the forecast probability for convective precipitation (same model runs).
In the case shown in Fig8.1.8-7 many ENS members suggest CIN can be fairly easily overcome (CIN <50J/kg) releasing quite vigorous convection (large CAPE values - ENS control ~3500J/kg, HRES ~3000J/kg). The probability of precipitation chart shows that <35% of ENS members are producing showers totalling >1mm in the period 00UTC to 06UTC. Nevertheless the CIN/CAPE diagram suggests that quite active convection with heavier showers has been quite possible during the preceding 6hr period given sufficient energy input to overcome CIN - this might be dynamical or mechanical uplift. As this was night time it seems more likely that solar heating during the morning will overcome the CIN leading to active convective cells.
It is wise to consider both the probability of convective precipitation charts and the vertical profiles together rather than using either alone to assess the possibility of active convective cells.
Vertical Profile Sequence showing variation of CIN and CAPE through 24 hours
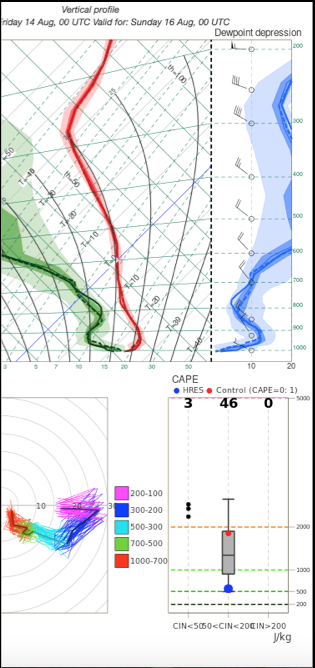
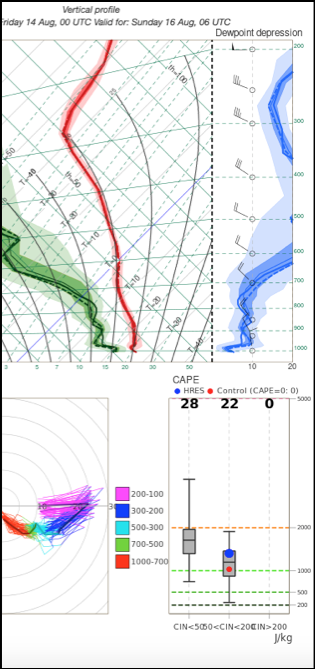
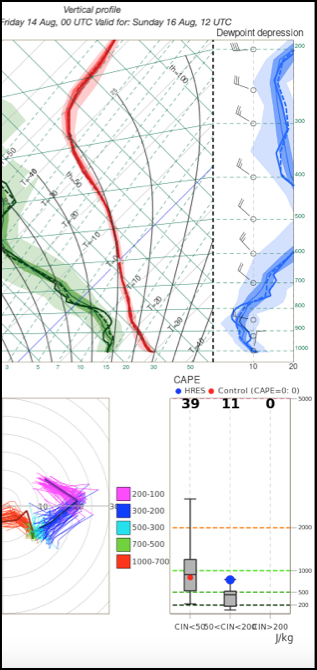
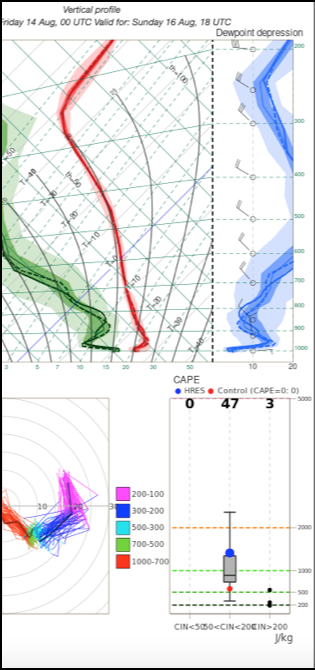
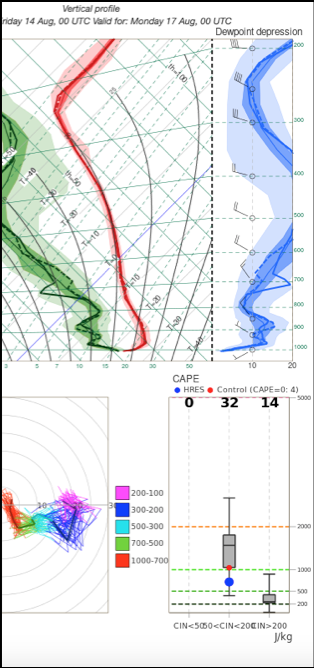
Fig8.1.8-8: Sequence of forecast vertical profiles for Brindisi, Italy illustrating the variation in CIN and consequent availability of CAPE through a full 24h diurnal cycle in which the structure of the atmosphere above the lowest layers remains largely unchanged. Here, for simplicity, CIN is defined as: low CIN<50J/kg, moderate 50J/kg<CIN<200J/kg, large CIN>200J/kg.
In Fig8.1.8-8:
- At 00UTC 16 Aug: There is a low-level inversion and generally the lower layers have a low humidity. The majority of ENS members (46) suggest fairly active free convection (CAPE mostly >1000J/kg) could be released if sufficient energy were available. HRES suggests less vigorous convection (CAPE~500J/kg) after CIN is overcome. However, near the surface, some ENS temperature and humidity values are high and a few ENS members (3) suggest rather stronger free convection (CAPE>2000J/kg) could be released with only rather low energy input required to overcome CIN. A small minority of ENS members (2) indicate CIN will not be overcome and free convection will not be initiated. At this time there is no solar energy to overcome CIN but the values shown give an indication of what would be required during the following 12hrs or so to release free convection. Potentially mechanical or dynamical uplift will also play a part.
- At 06UTC 16 Aug: The low-level inversion has been somewhat eroded through early diurnal heating but some ENS members show high low-level humidity. Many ENS members (28) suggest only rather low energy input is now required to overcome CIN and release moderately active free convection (CAPE<2000J/kg). Other ENS members (22) suggest more substantial energy input is required to overcome CIN and release moderately active free convection (CAPE <~1500J/kg). At this time solar heating is becoming a major source of energy to overcome CIN, but potentially mechanical or dynamical uplift will also play a part.
- At 12UTC 16 Aug: The inversion has been broken and CIN is now small and free convection can be released by a further rise in surface temperature or by uplift of the moist zone near 900hPa. However, uplift of drier low level layers shown by some ENS members requires a more substantial input of energy sufficient to release free convection and CIN is consequently higher. The resulting free convection is rather weak (CAPE<~1000J/kg), because of the lower near-surface dew points.
- At 18UTC 16 Aug: The low-level inversion is reforming with evening radiative cooling, or by shallow near-surface cold advection from the Adriatic on easterly winds, but the low-level humidity remains similar to earlier in the day. Consequently CIN is increasing and more substantial energy input is required to release free convection. The majority of ENS members (47) suggest moderately active free convection (CAPE mostly <~1500J/kg) could be released if sufficient energy were available to overcome moderate CIN. A small minority of ENS members (3) indicate large CIN is required before releasing weaker free convection (CAPE <~500J/kg). During the evening only mechanical or dynamical uplift is likely to supply the energy to overcome CIN.
- At 00UTC 17 Aug: The low-level inversion has reformed fully with high relative and absolute humidity in the near-surface layers. CIN is rather larger than at 18UTC, on balance, and substantial energy input is required to release free convection. Most ENS members (32) suggest moderately active free convection (CAPE mostly <~1500J/kg) could be released if sufficient energy were available to overcome moderate CIN. An increased number of ENS members (14) indicate large CIN needs to be overcome before releasing weak free convection (CAPE <~300J/kg). A small minority of ENS members (4) indicate CIN will not be overcome and free convection will not be initiated. Overnight only mechanical or dynamical uplift can supply the energy to overcome CIN.
Although this case does not definitively highlight active convection, the hodographs indicate some vertical shear through the model atmosphere which would be conducive to organised deep moist convection if large CAPE were available and were released.
Forecast vertical profiles in the vicinity of a mobile cold front

Fig8.1.8-9: The ENS forecast frontal zones from the cyclone database products (example) T+120hr VT:00UTC 22 Aug 2020, DT:00UTC 17 Aug 2020. Inset shows magnified area around Denmark. Animation of cyclone database products allows an assessment of the developing spread and changing intensity of frontal features.

Fig8.1.8-10: An example of forecast vertical profiles in the vicinity of a mobile cold front crossing Denmark, T+120hr VT:00UTC 22 Aug 2020, DT:00UTC 17 Aug 2020. There are a range of forecast positions of the front among the ENS solutions but HRES (thick solid) and ENS Control (thick dotted) both position the front approximately between Copenhagen and Odense. The East/West section through this zone illustrates the differences in the structure of the model atmospheres, particularly in the spread of the ENS temperatures and dewpoints. The pale blue colouring approximately encloses the range of ENS positions for the front.
In Fig8.1.8-10 the airmasses to the east and west of the frontal zone have some well-marked identifying features:
- to the east (55N 15E) there is a zone of warm air in the lowest layers (~24°C) and moisture content (~8g/kg) is uniform up to about 800hPa. The spread of temperatures and dew points (darker shades of red and green respectively) is quite narrow with few outliers (lighter shading) suggesting confidence in the ENS model structure of the pre-frontal airmass.
- to the west (56N 06E) the air is cooler (~18°C) and moisture content decreases rapidly with height. The spread of temperatures and dew points (darker shades of red and green respectively) is quite narrow near the surface although there are outliers (lighter shading) suggesting some uncertainty in the structure of the ENS model structure of the post-frontal airmass. In mid-levels confidence in dewpoint is low - this may signify uncertainty in where the (rearward sloping) cold frontal surface lies.
The remaining vertical profiles illustrate the transition between the air masses through the frontal zone with characteristics of both evident to a greater or less extent depending upon the positioning of the front by each ENS member.
Some other interesting features can be identified; mostly the HRES and Control runs (single thick lines) are representative of the ensemble, but in some respects they are not - e.g. Control has anomalously warm low level air well ahead of the front (55N 15E).
The ECMWF front spaghetti plot (Fig8.1.8-9) indicates that:
- there is a broad spread in ENS cold front positions,
- but HRES (thick green line, strictly the front at 1km altitude) lies slightly towards the forward edge of the range of ENS positions.
When assessing the timing (and activity) during the passage of a front at a given location it is wise to examine:
- a fixed-time animation of synoptic charts from the cyclone database products (not shown) to assess the variation in synoptic pattern.
- an animation of the frontal zones from the cyclone database products (Fig8.1.8-9) to assess the evolution of the spread of forecast positions.
- vertical profiles on a pseudo cross-section spanning the range forecast frontal zones, to assess the higher probabilities of frontal structure (e.g. incursion of drier air, persistence of warm air, potential release of instability, frontal slope in the vertical).
Additional Sources of Information
(Note: In older material there may be references to issues that have subsequently been addressed)
Read more information on “Using ECMWF's new ensemble vertical profiles”.
See summer 2018 ECMWF Newsletter article (P39-44).
IFS model levels for: HRES, ENS (137). Note: every model level is used in the lower troposphere up to about 700mb, and only every other level higher up.


