Synoptic overview
HRES z500 (contour) and T850 (shade).


HRES MSLP and 6-hour precipitation (following the time for MSLP).


Stamp map for MSLP +120h
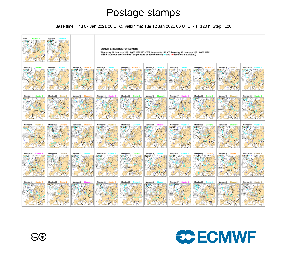
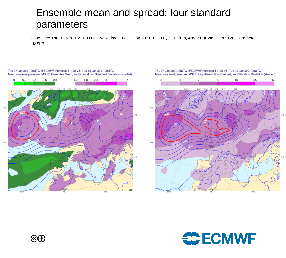
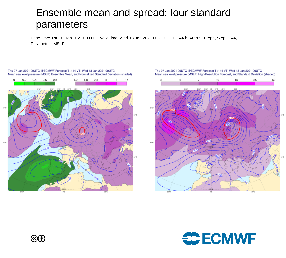
Ensemble forecasts for MSLP. Left panels: Ensemble mean (contour) and normalised ensemble spread (shade). Right panels: HRES and ensemble spread.
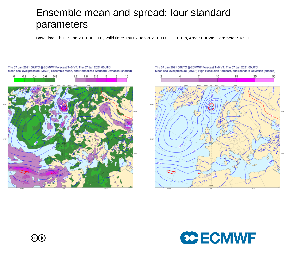

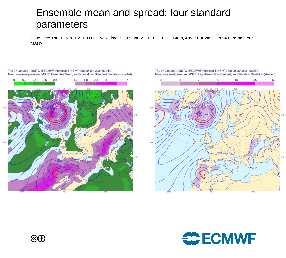
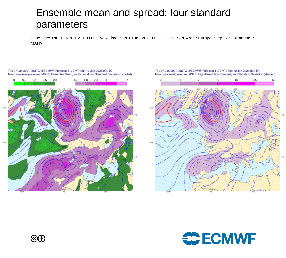

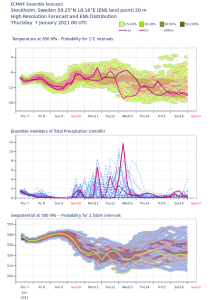
Ensemble Plume
Forecast User Guide: https://confluence.ecmwf.int/display/FUG/Plumes
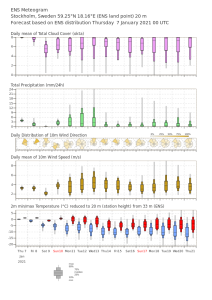
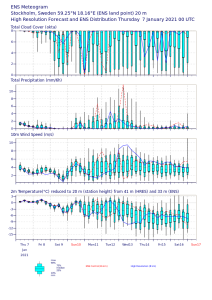
Metgrams
Forecast User Guide: Meteograms
Regime products
For background and discussion around different regime products, see: https://www.ecmwf.int/en/newsletter/165/meteorology/how-make-use-weather-regimes-extended-range-predictions-europe
Extended Range Weather Regime Frequency histogram
Forecast User Guide: Extended Range Regime Charts
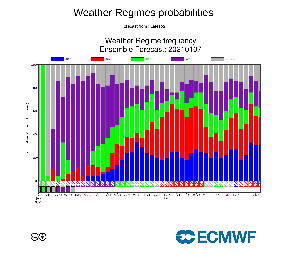
Regime Chart
Forecast User Guide: Medium Range Regime Charts

Z500 clusters
Forecast User Guide: Clustering - ENS Medium-Range

Extra-tropical cyclone diagrams
Cyclone Feature Dalmatian plots for MSLP
Forecast User Guide: Extratropical Cyclone Diagrams

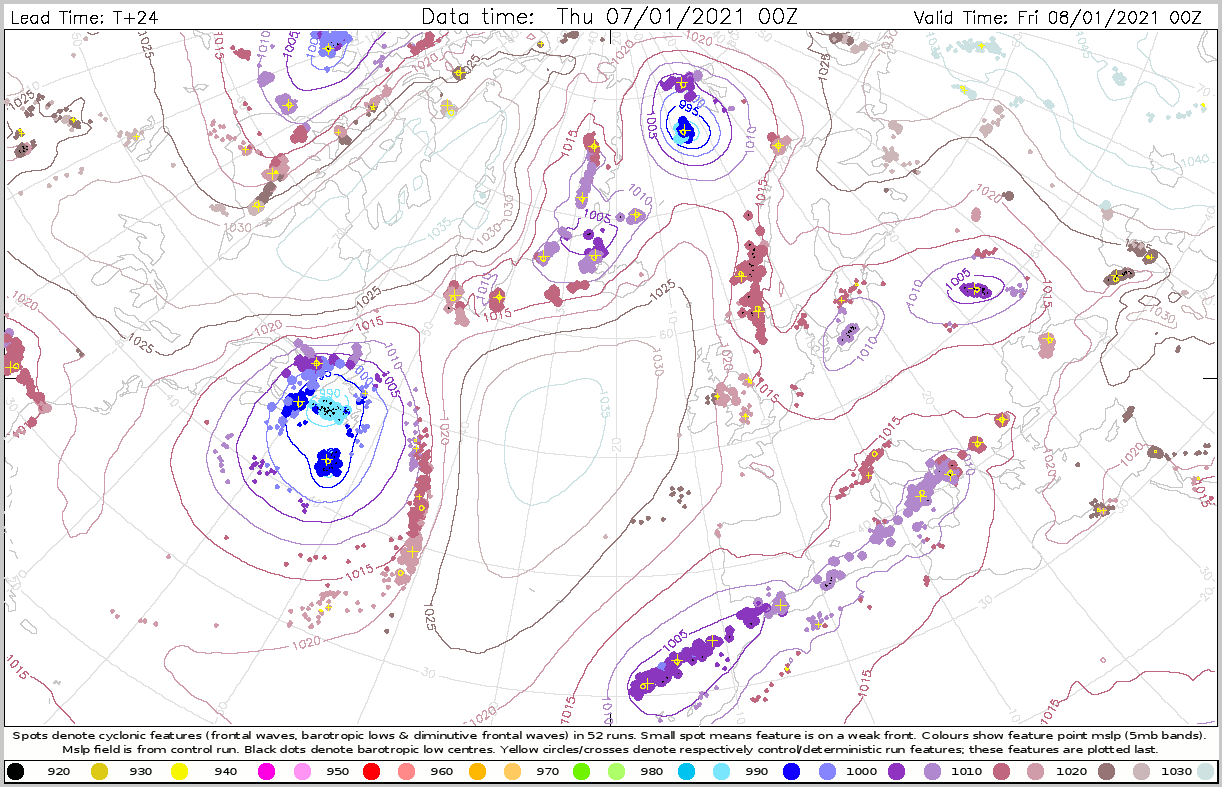


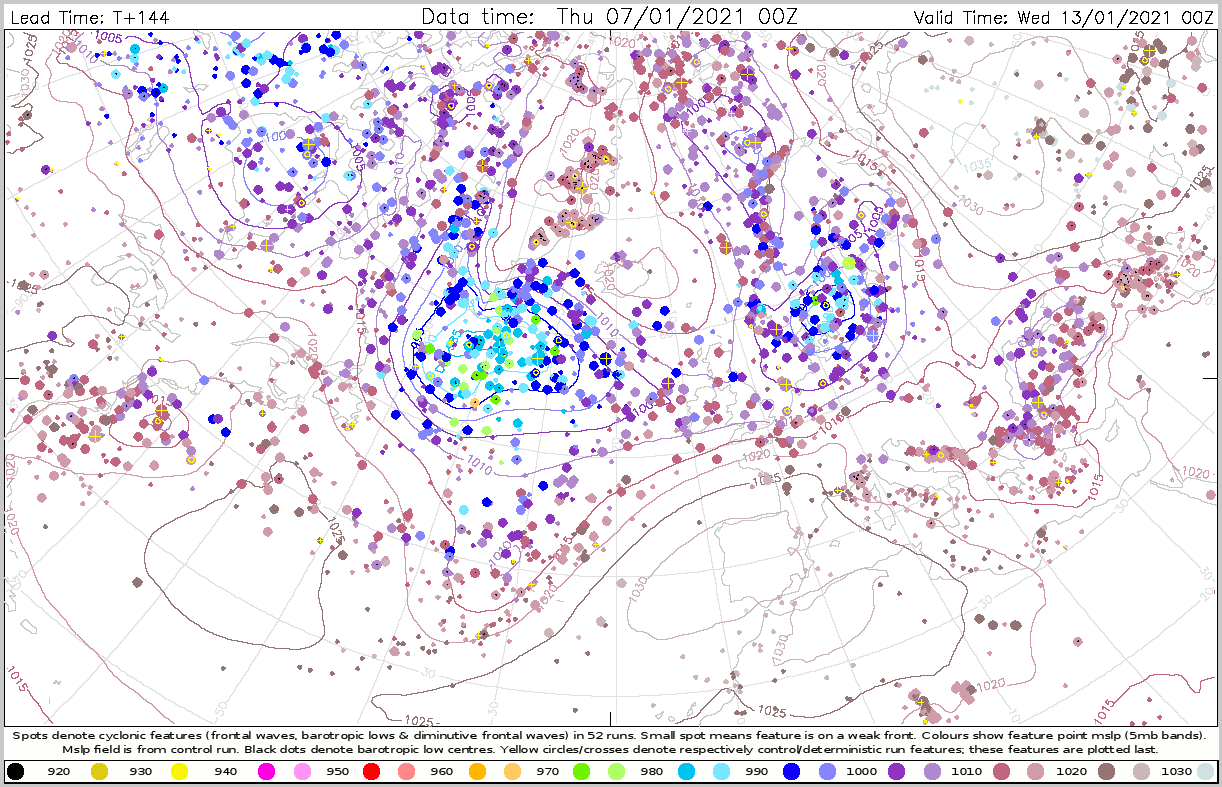
Cyclone Feature Dalmatian plots for max Snow
Forecast User Guide: Extratropical Cyclone Diagrams

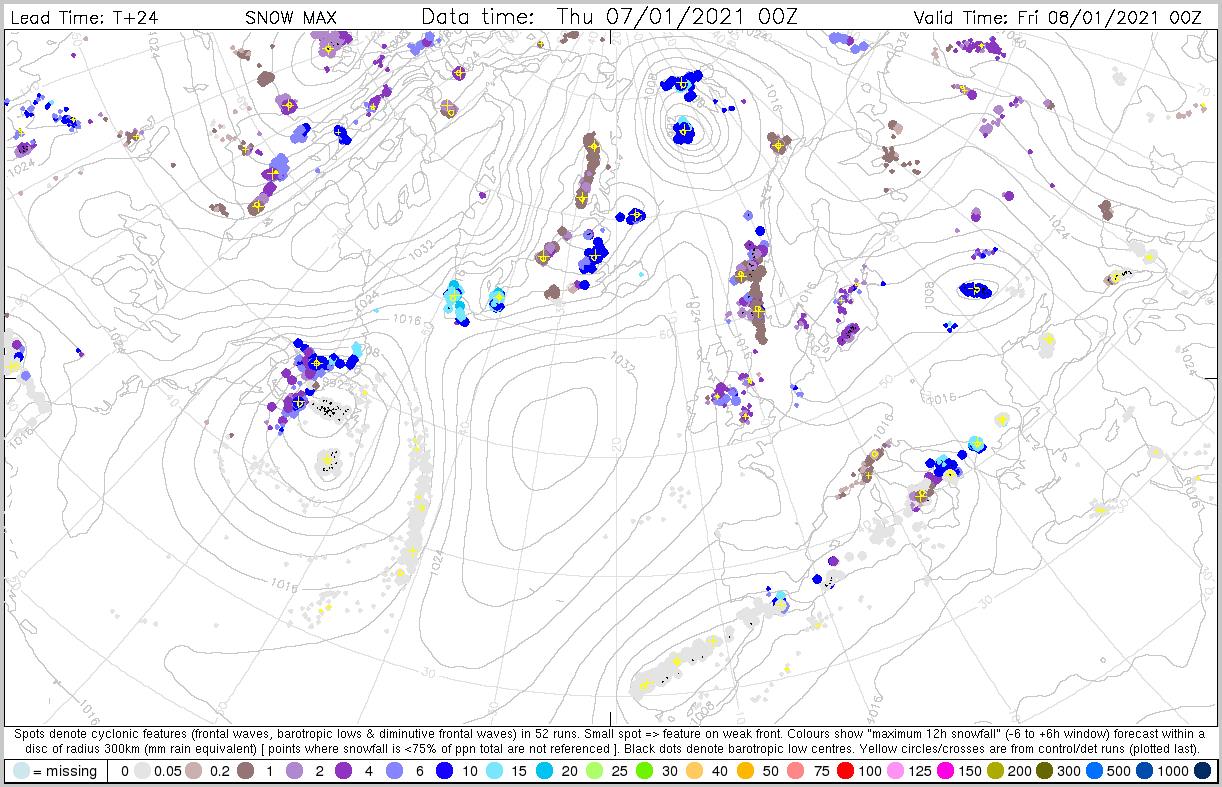
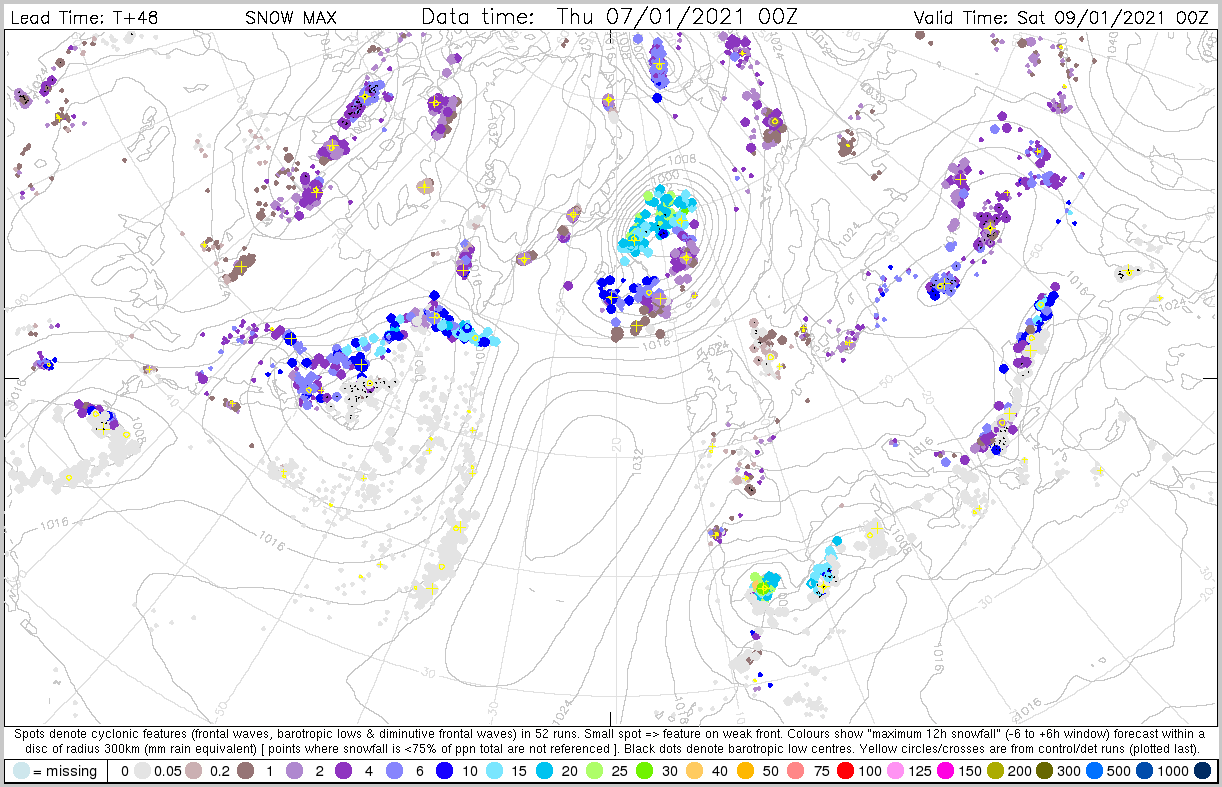

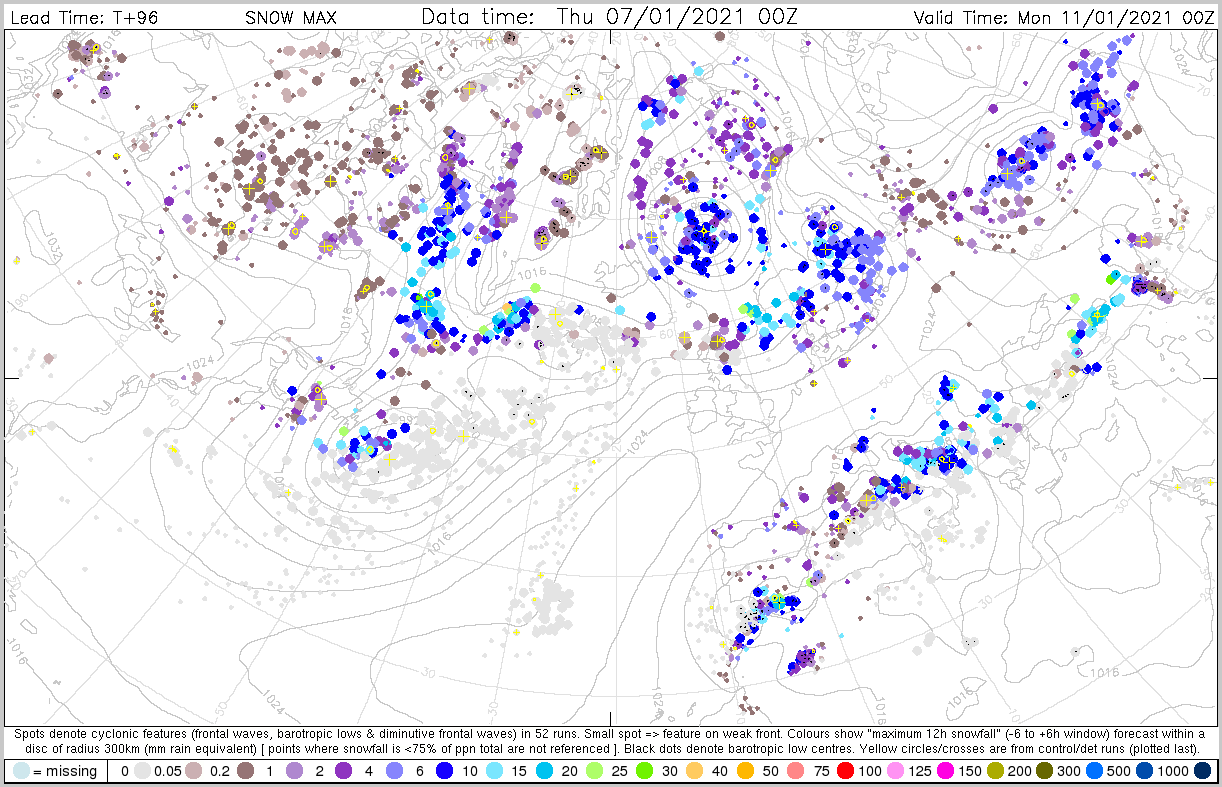
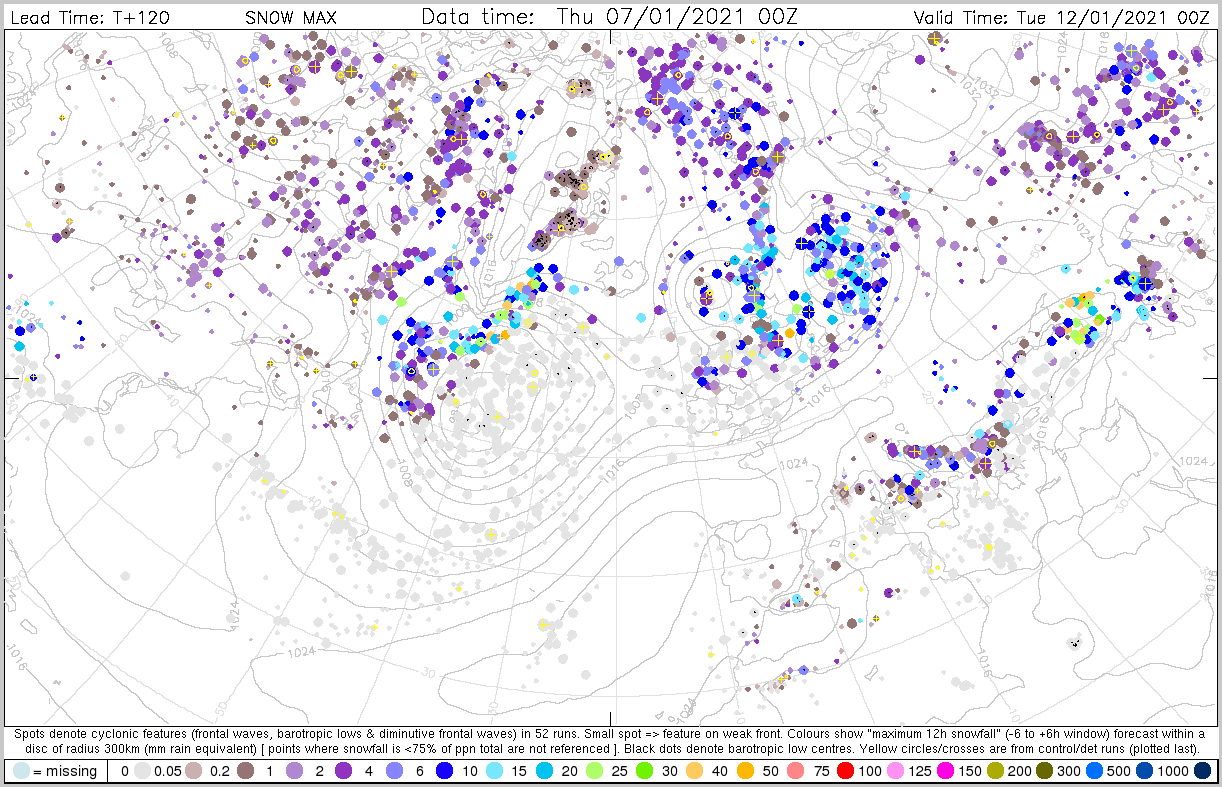
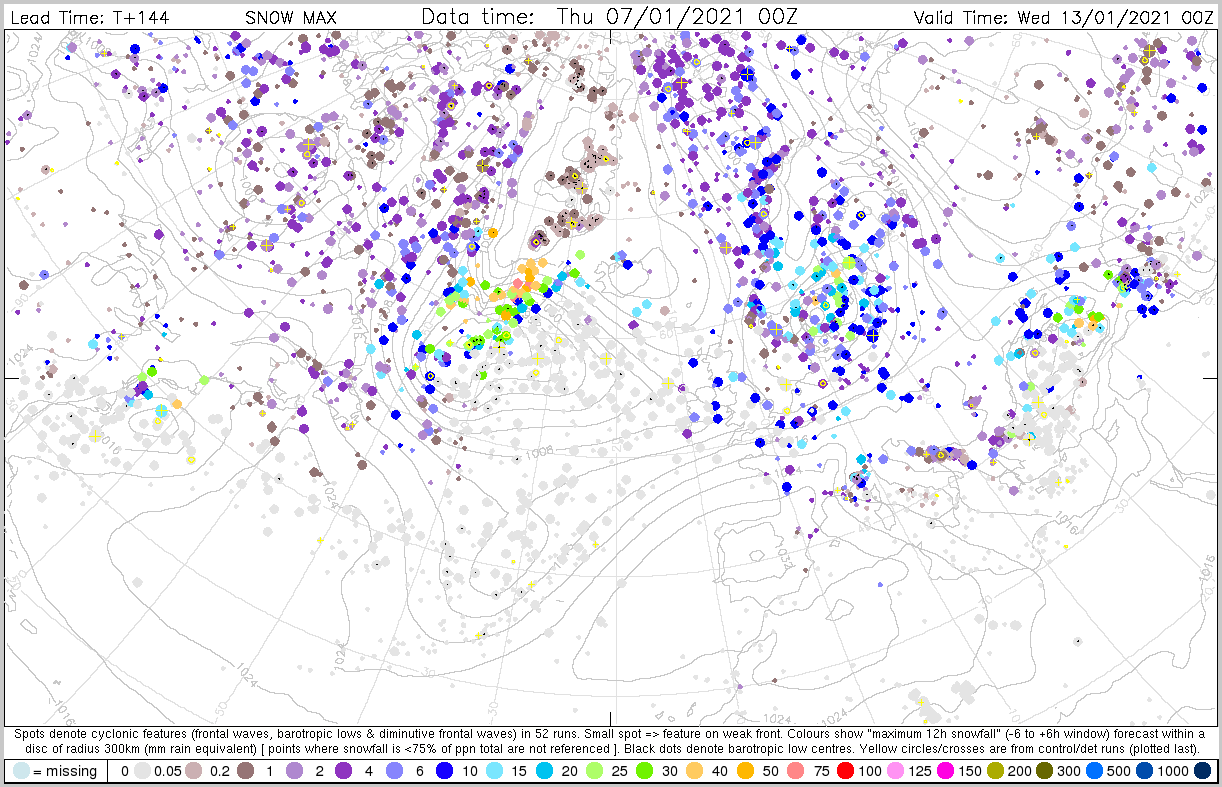
Cyclone Feature front plots
Forecast User Guide: Extratropical Cyclone Diagrams


Extreme forecast Index (EFI) and Shift of Tails (SOT)
Forecast User Guide: Extreme Forecast Index - EFI, and Shift of Tails - SOT
EFI and SOT for 2-metre mean temperature


EFI and SOT for 24-hour maximum wind gusts


EFI and SOT for 24-hour total precipitation


