Long Range (Seasonal) Anomaly Correlation Coefficient Charts
These charts shows the Anomaly Correlation Coefficient (ACC) for the seasonal anomalies derived from the ECMWF Seasonal Forecast (SEAS5).
The ACC scores show the spacial correlation between:
- the anomaly of the seasonal forecast (SEAS5) measured against a corresponding three month average model climatology based on the ERA-interim re-analysis (for the period 1993-2016)
- the anomaly of the verifying observations measured against a corresponding three month average model climatology based on the ERA-interim re-analysis (for the period 1981-2016).
The Anomaly Correlation Coefficient represents a measure of how well the seasonal (SEAS5) forecast anomalies have represented the observed anomalies.
The colouring on the charts gives the measure of success of the SEAS5 forecast in representing the actual conditions:
- Brown, red and orange colouring imply seasonal (SEAS5) forecast anomalies have successfully represented the observed anomalies.
- Light orange and yellow colouring imply seasonal (SEAS5) forecast anomalies have had only limited success in representing the observed anomalies.
- Grey and blue colouring imply seasonal (SEAS5) forecast anomalies have had no success or been misleading in representing the observed anomalies.
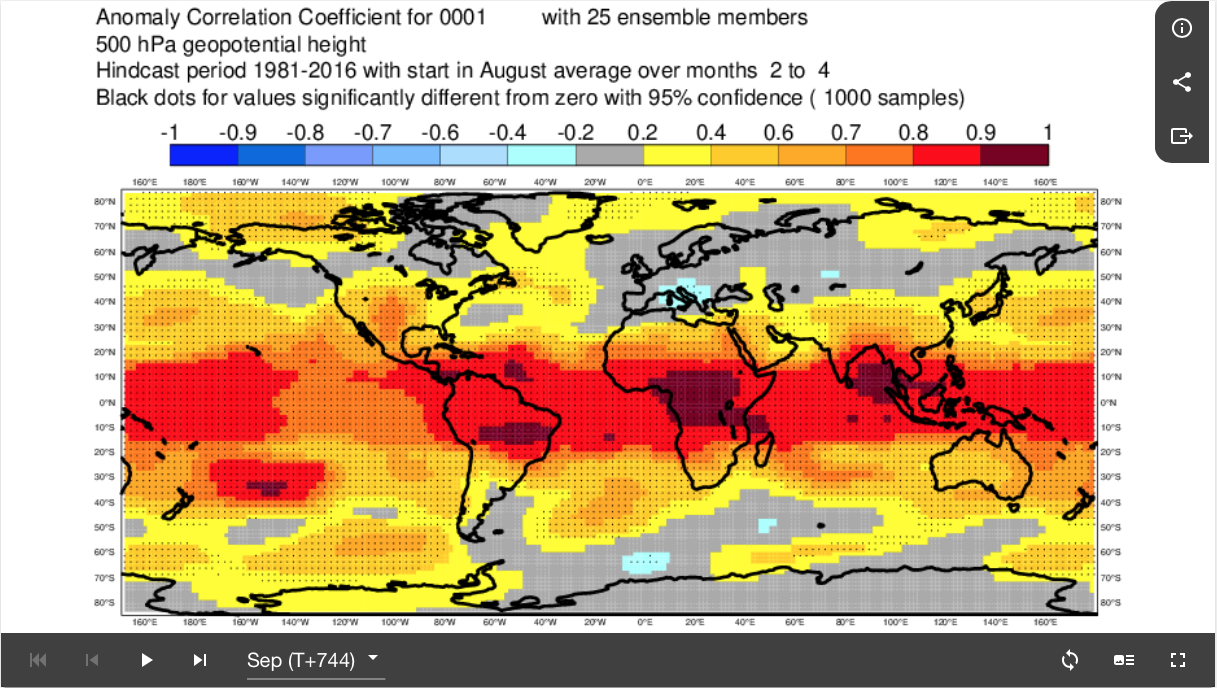
Fig8.3.2-1: Chart of Anomaly Correlation Coefficient for 500hPa geopotential height for the verifying period Sep, Oct, Nov derived from SEAS5 runs with data time of early Aug. This compares the spacial correlation between:
- the anomaly of SEAS5 for the period Sep, Oct, Nov based on the SEAS5 run with data time of early Aug as measured against an averaged model climatology for the period Sep, Oct, Nov derived from past SEAS5 runs with data time of early Aug.
- the anomaly of the verifying observations over the period Sep, Oct, Nov as measured against an averaged model climatology for the period Sep, Oct, Nov derived from past SEAS5 runs with data time of early Aug.
Values above about 0.6 (orange, red, brown) indicate success of the SEAS5 forecast in representing the observed anomalies. Negative values (grey and blues) indicate no success (or actually misleading) SEAS5 forecast in representing the observed anomalies. Black dots signify 95% confidence.
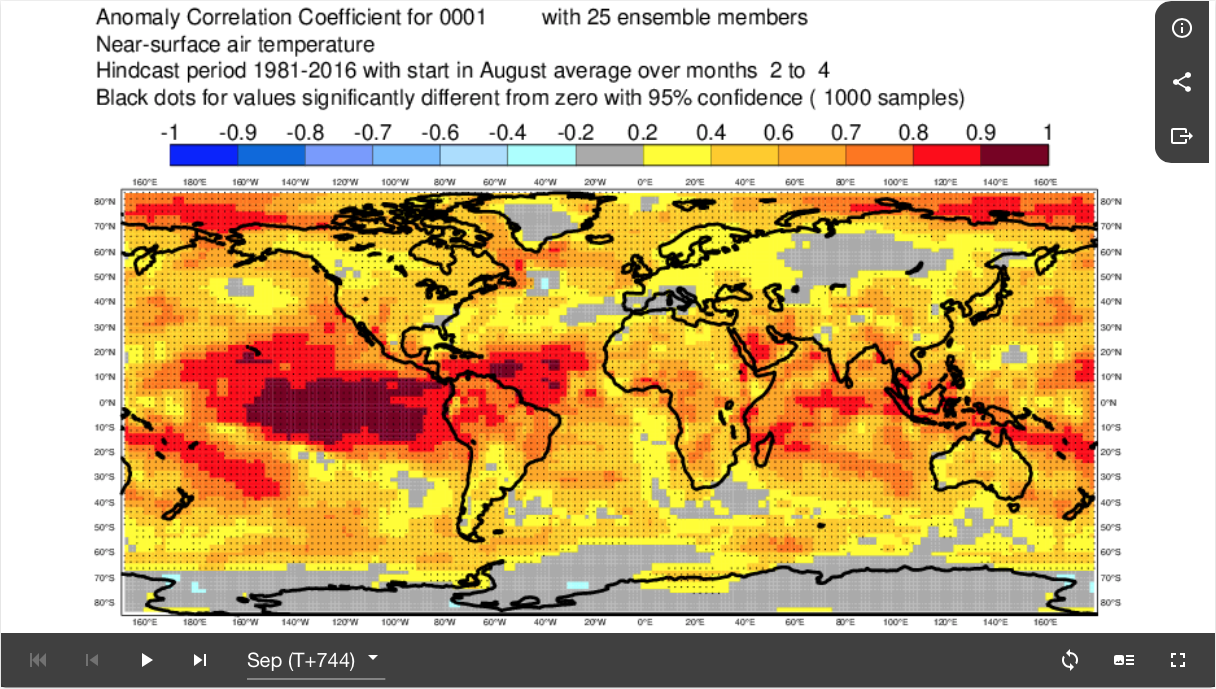
Fig8.3.2-2: Chart of Anomaly Correlation Coefficient for 2m temperature for the verifying period Sep, Oct, Nov derived from SEAS5 runs with data time of early Aug. This compares the spacial correlation between:
- the anomaly of SEAS5 for the period Sep, Oct, Nov based on the SEAS5 run with data time of early Aug as measured against an averaged model climatology for the period Sep, Oct, Nov derived from past SEAS5 runs with data time of early Aug.
- the anomaly of the verifying observations over the period Sep, Oct, Nov as measured against an averaged model climatology for the period Sep, Oct, Nov derived from past SEAS5 runs with data time of early Aug.
Values above about 0.6 (orange, red, brown) indicate success of the SEAS5 forecast in representing the observed anomalies. Negative values (grey and blues) indicate no success (or actually misleading) SEAS5 forecast in representing the observed anomalies. Black dots signify 95% confidence.

