...
Analyses from DWD (11 January every 6th hour)


Analyses from SMHI


Observations from Stockholm Arlanda (left) and Sundsvall () (from ogimet.com)
...
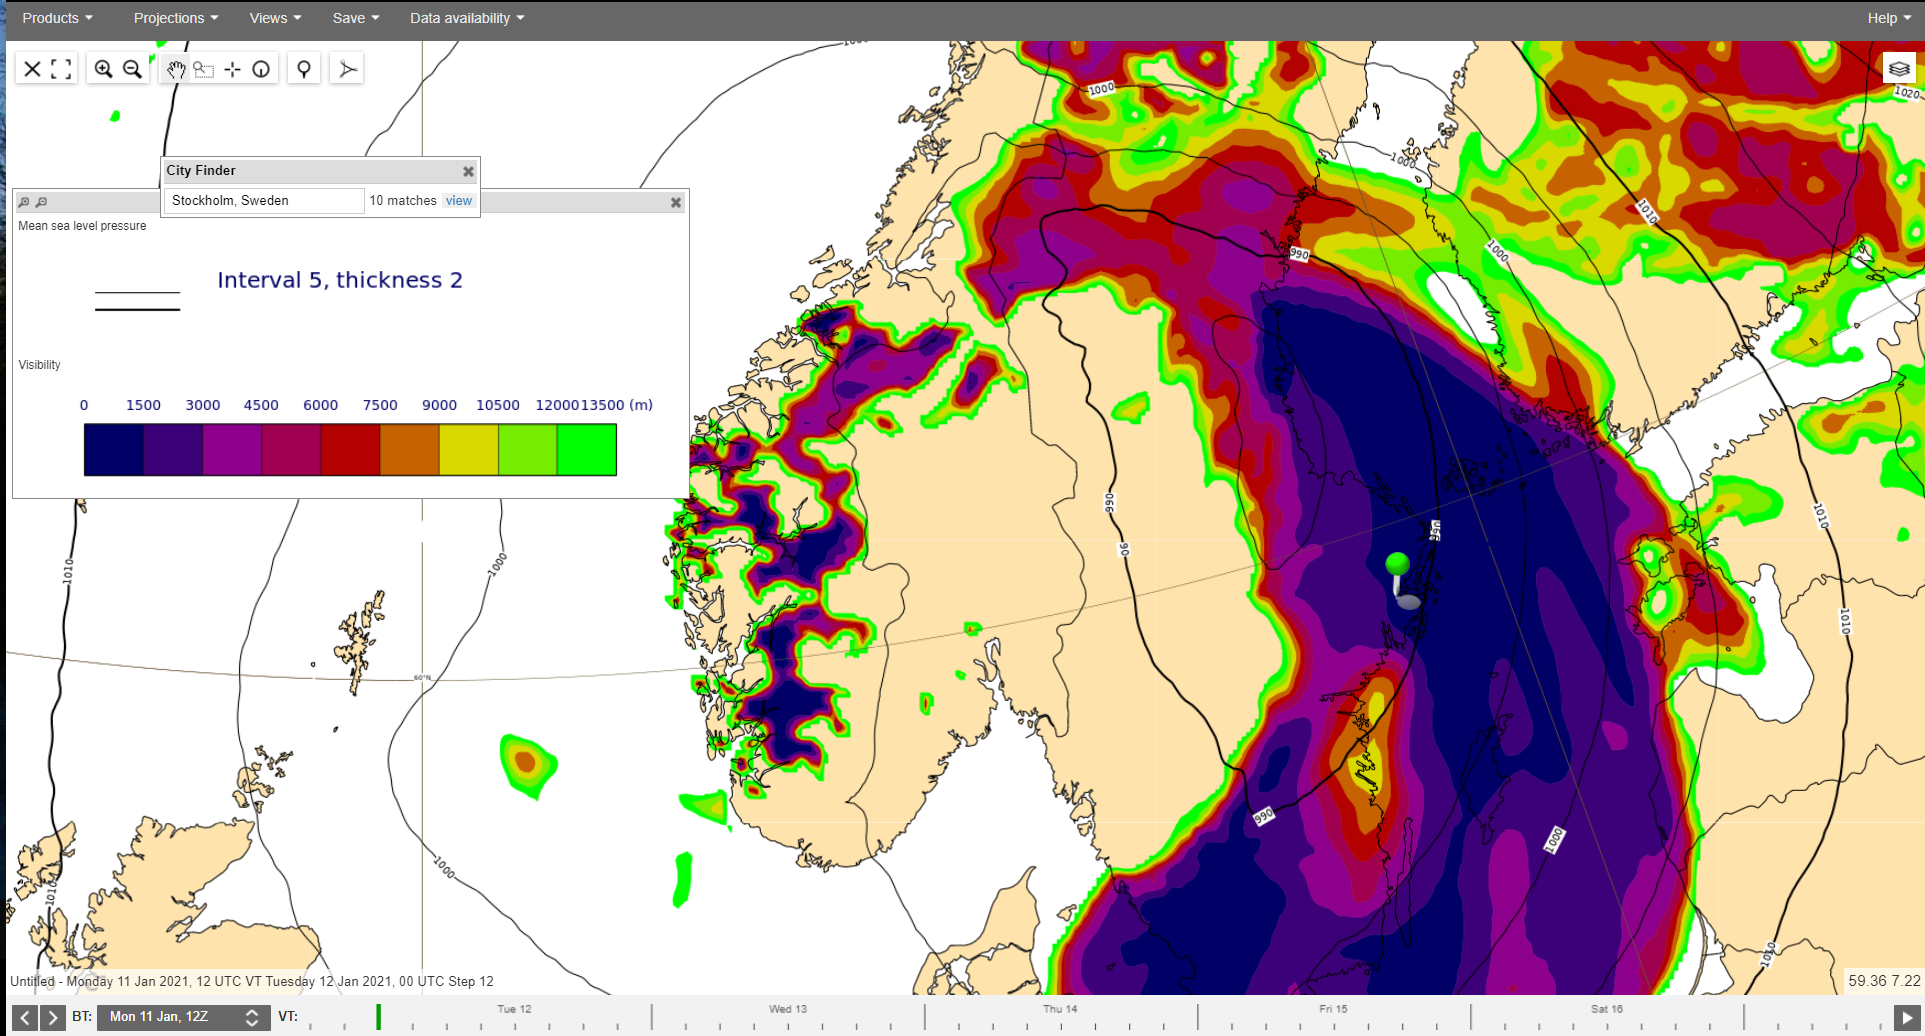
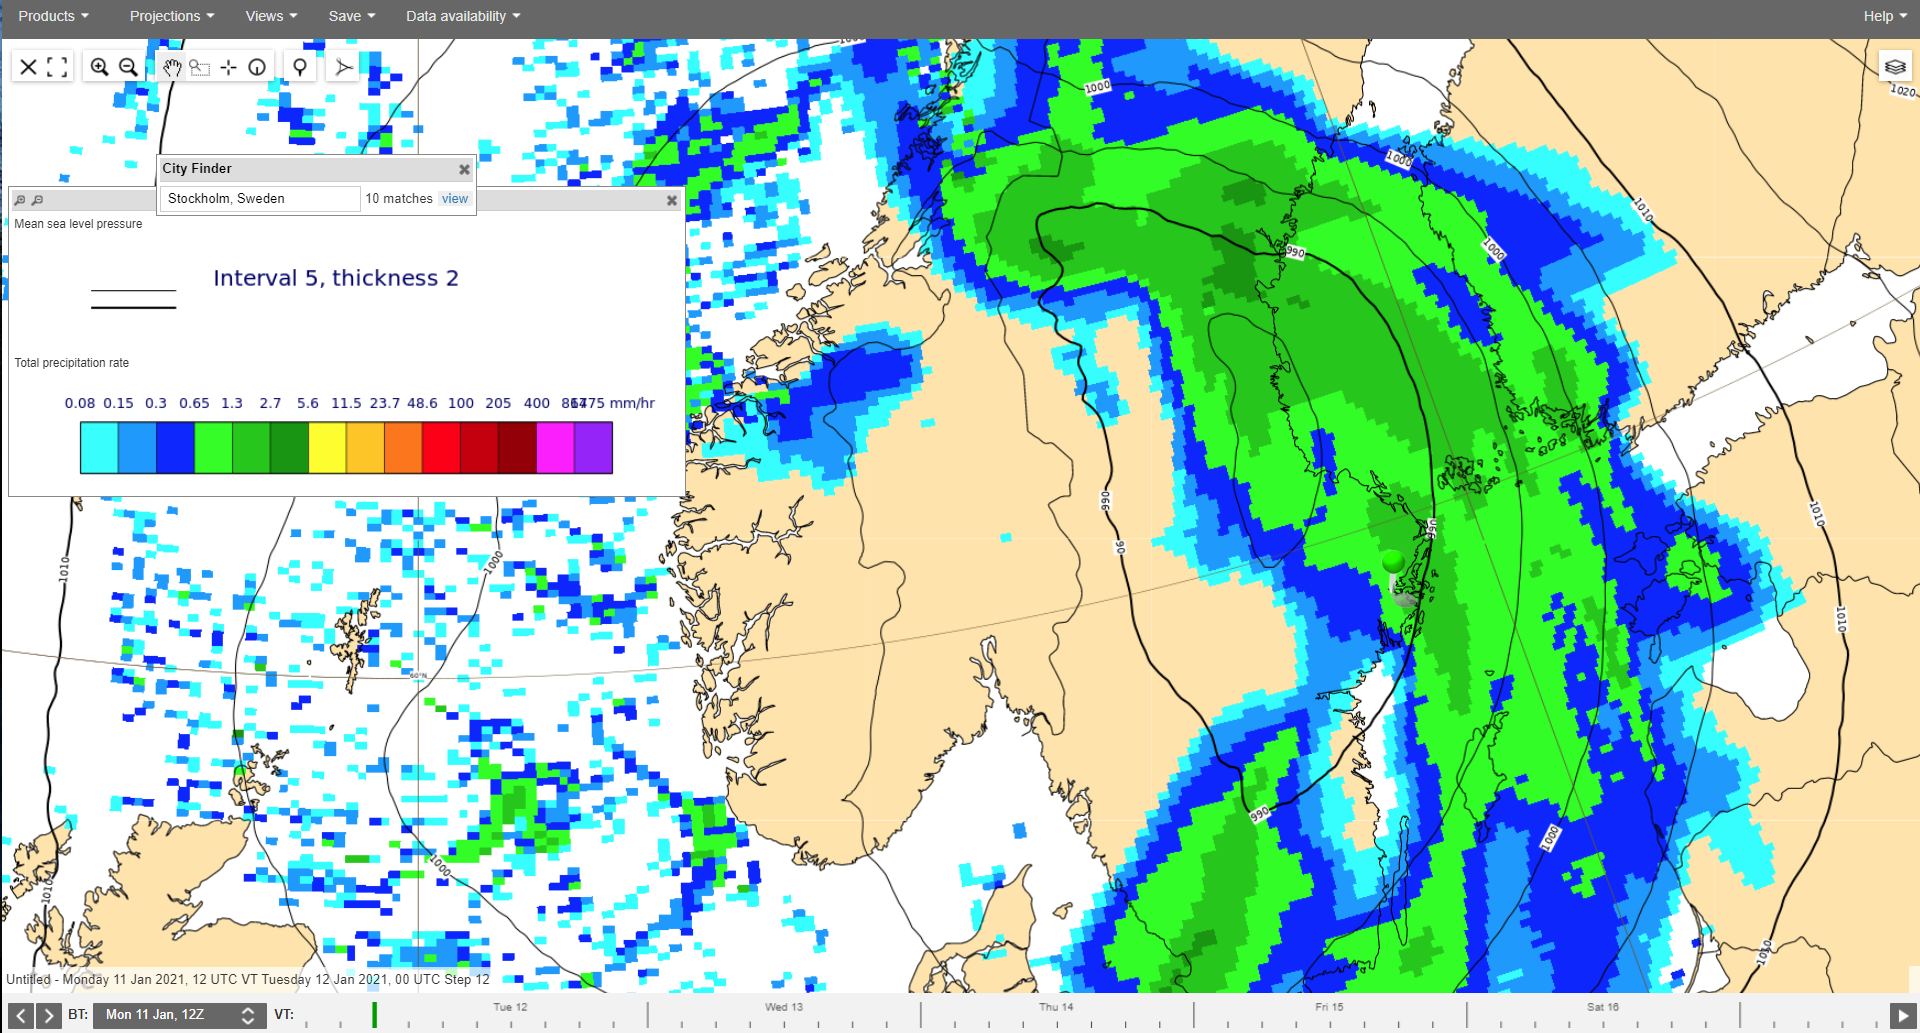
Forecasts from 11 January 12UTC+12 for visibility (left), snowfall rate (middle) and total precipitation rate (right)

Forecasts from 11 January 12UTC+12 for visibility for operational forecast (left, same as above) and for 47r3 experiment (right).


Metars from 3 airports along the Swedish east-coast:
...
METAR ESNO 112320Z AUTO 09021G31KT 1000
           R12/P2000N R30/P2000N -SN
           FEW002/// SCT005///
BKN010/// M01/M02 Q0997= |
...
ecPoint
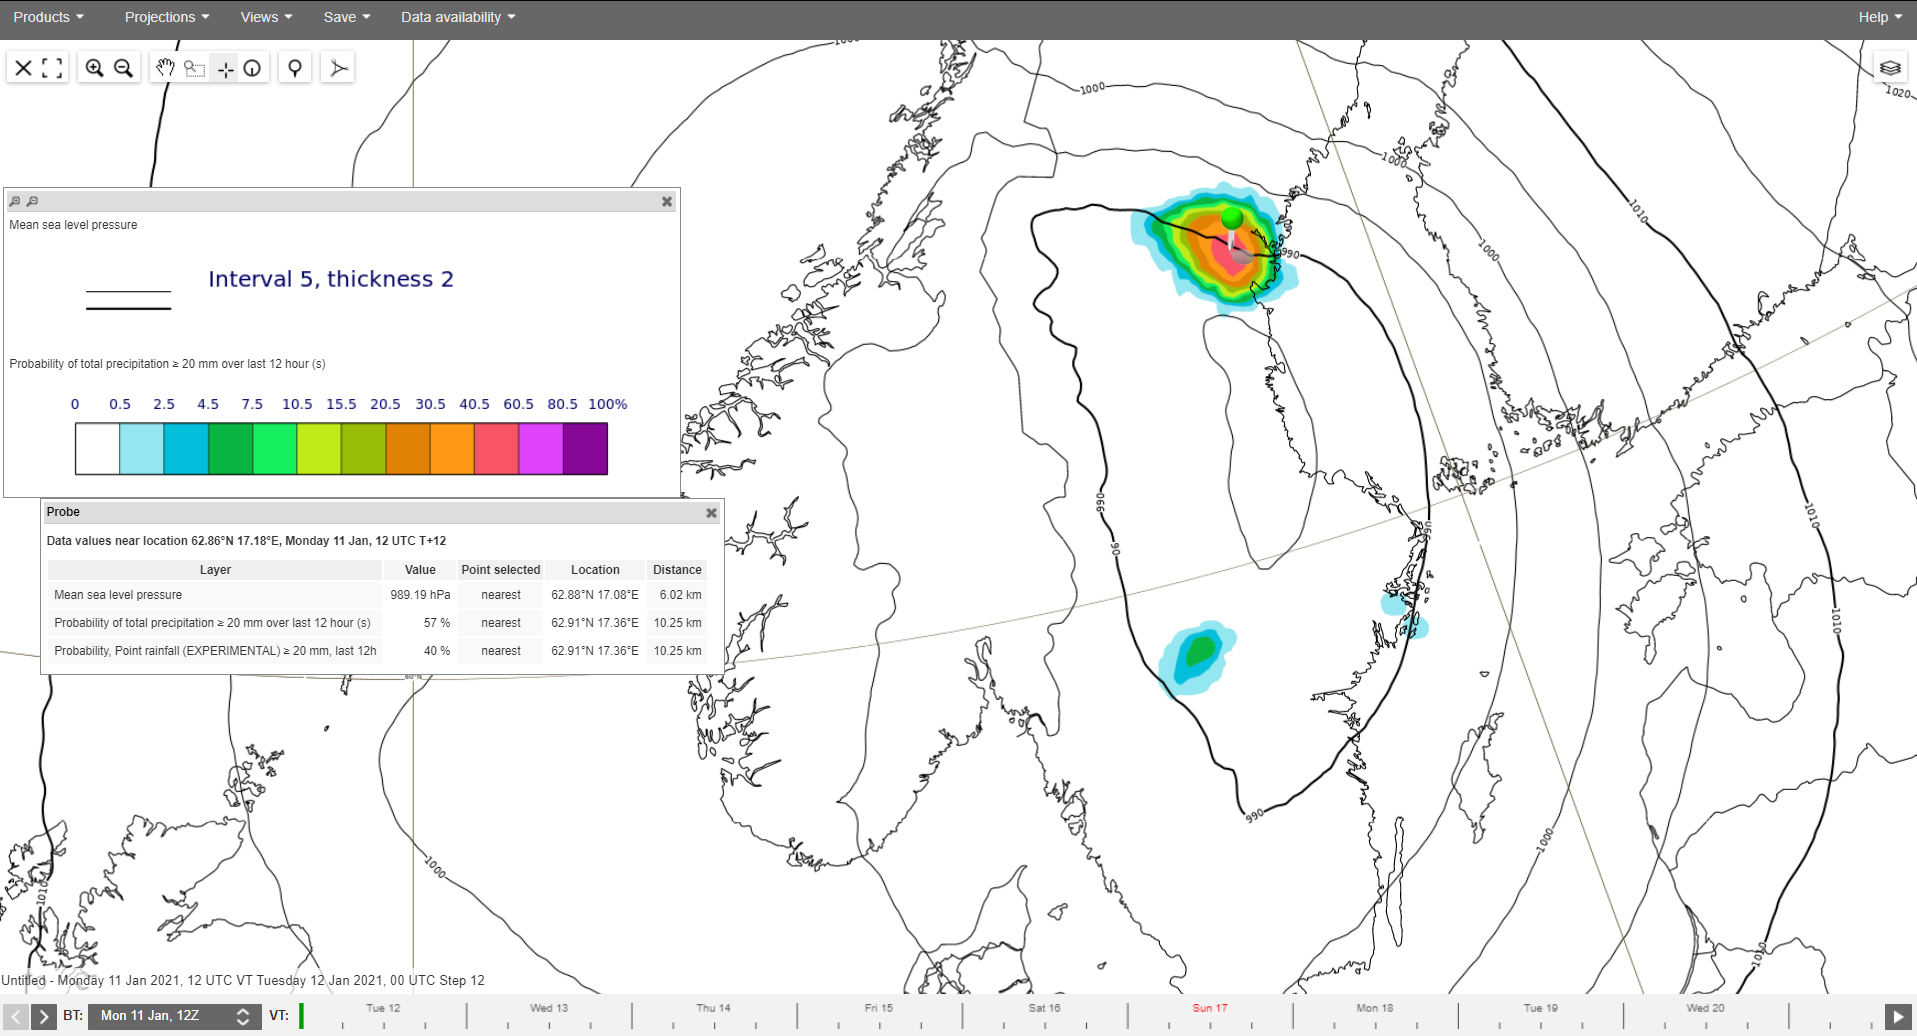
Probability for >20 mm/12h in raw ensemble (left) and
...
ecPoint (right).

CDF for precipitation for Stockholm (left) and northern point (right)
...
The plot below shows time-series of various parameters for a point in Southern Sweden in the forecast from 11 January 12UTC and the map for precipitation type for step 12.

2-metre temperature
To
...
evaluate the forecasts for the cold spell that followed after the cyclone, the plot below evaluates the forecasts for 2-metre temperature over southern Sweden 14-16 January, for the region outline in the 1-3 day EFI plot for the same period below. The cold signal started to appear on 28 December.


Seasonal anomalies


Seasonal anomalies