For evaluation of the outcome, see: 202101 - Snowfall - Sweden
For "Known Forecast Issues", see: Known IFS forecasting issues
Analyses from DWD (11 January every 6th hour)


Analyses from SMHI


Observations from Stockholm Arlanda (left) and Sundsvall () (from ogimet.com)


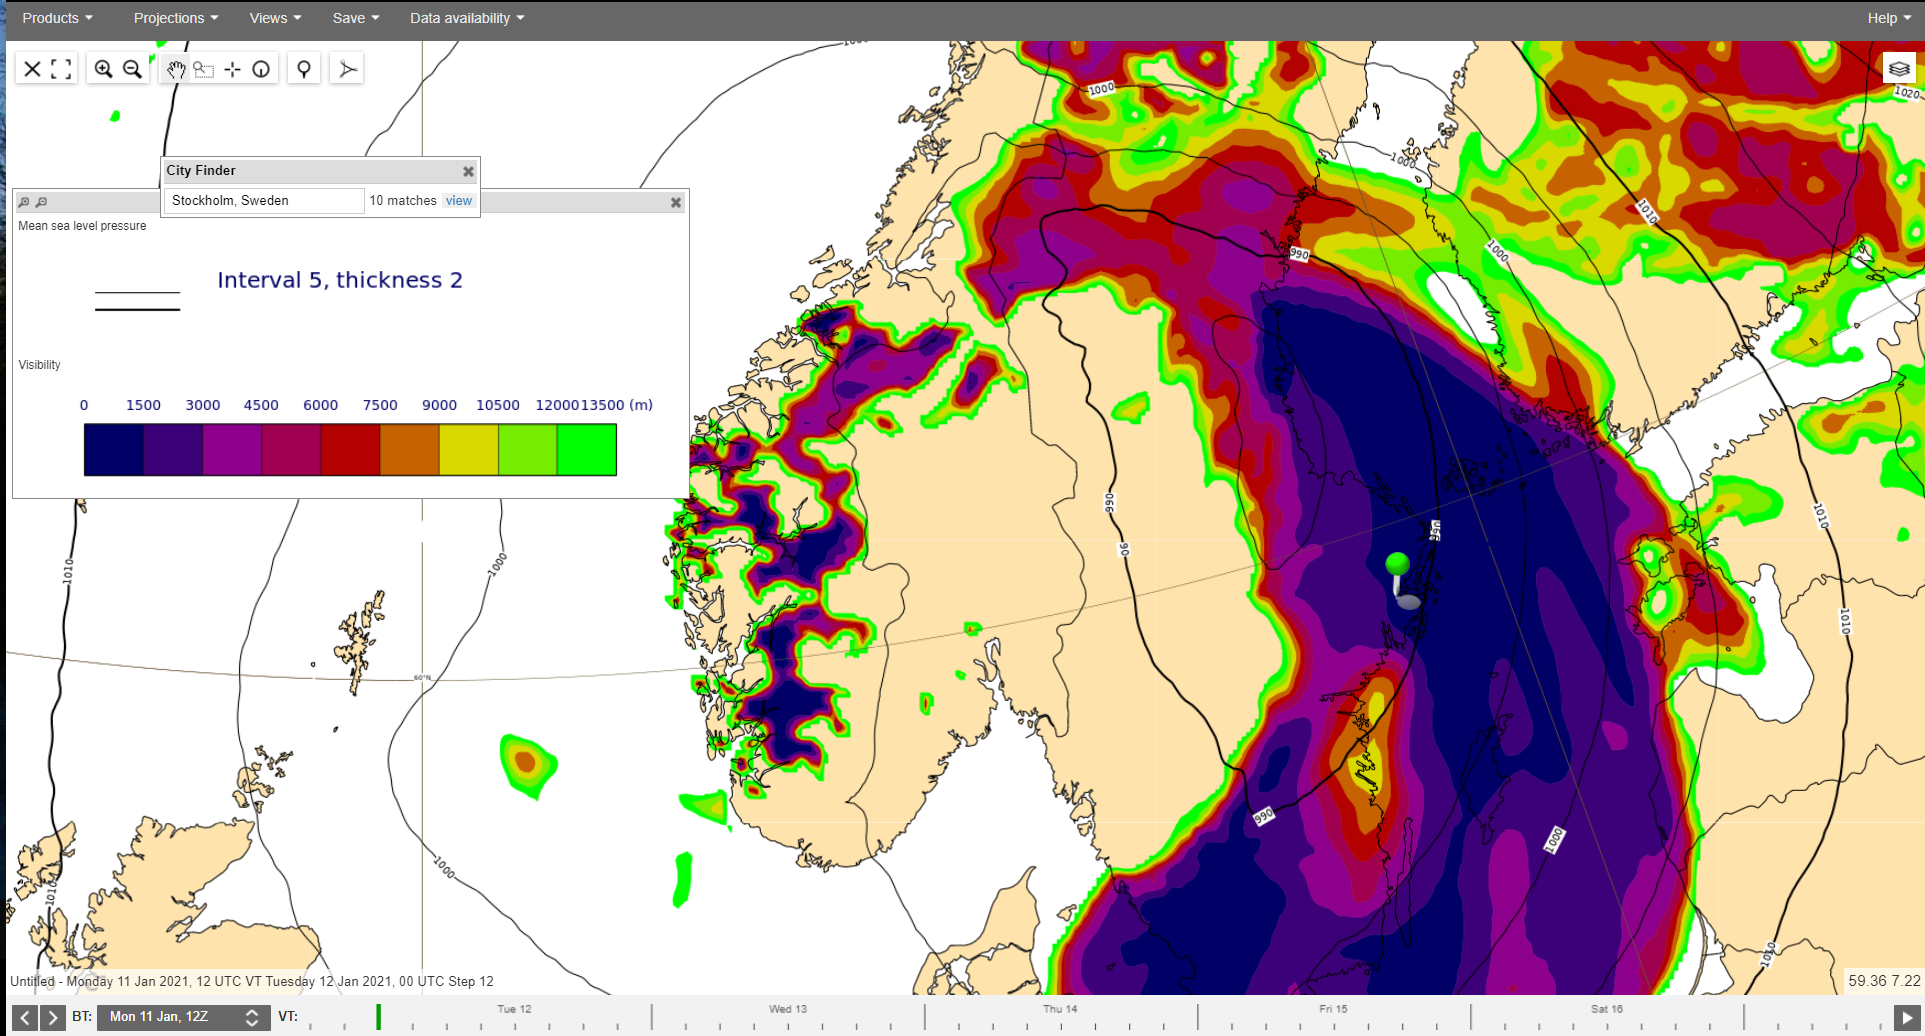
Short visibility forecast
(See issue M9)
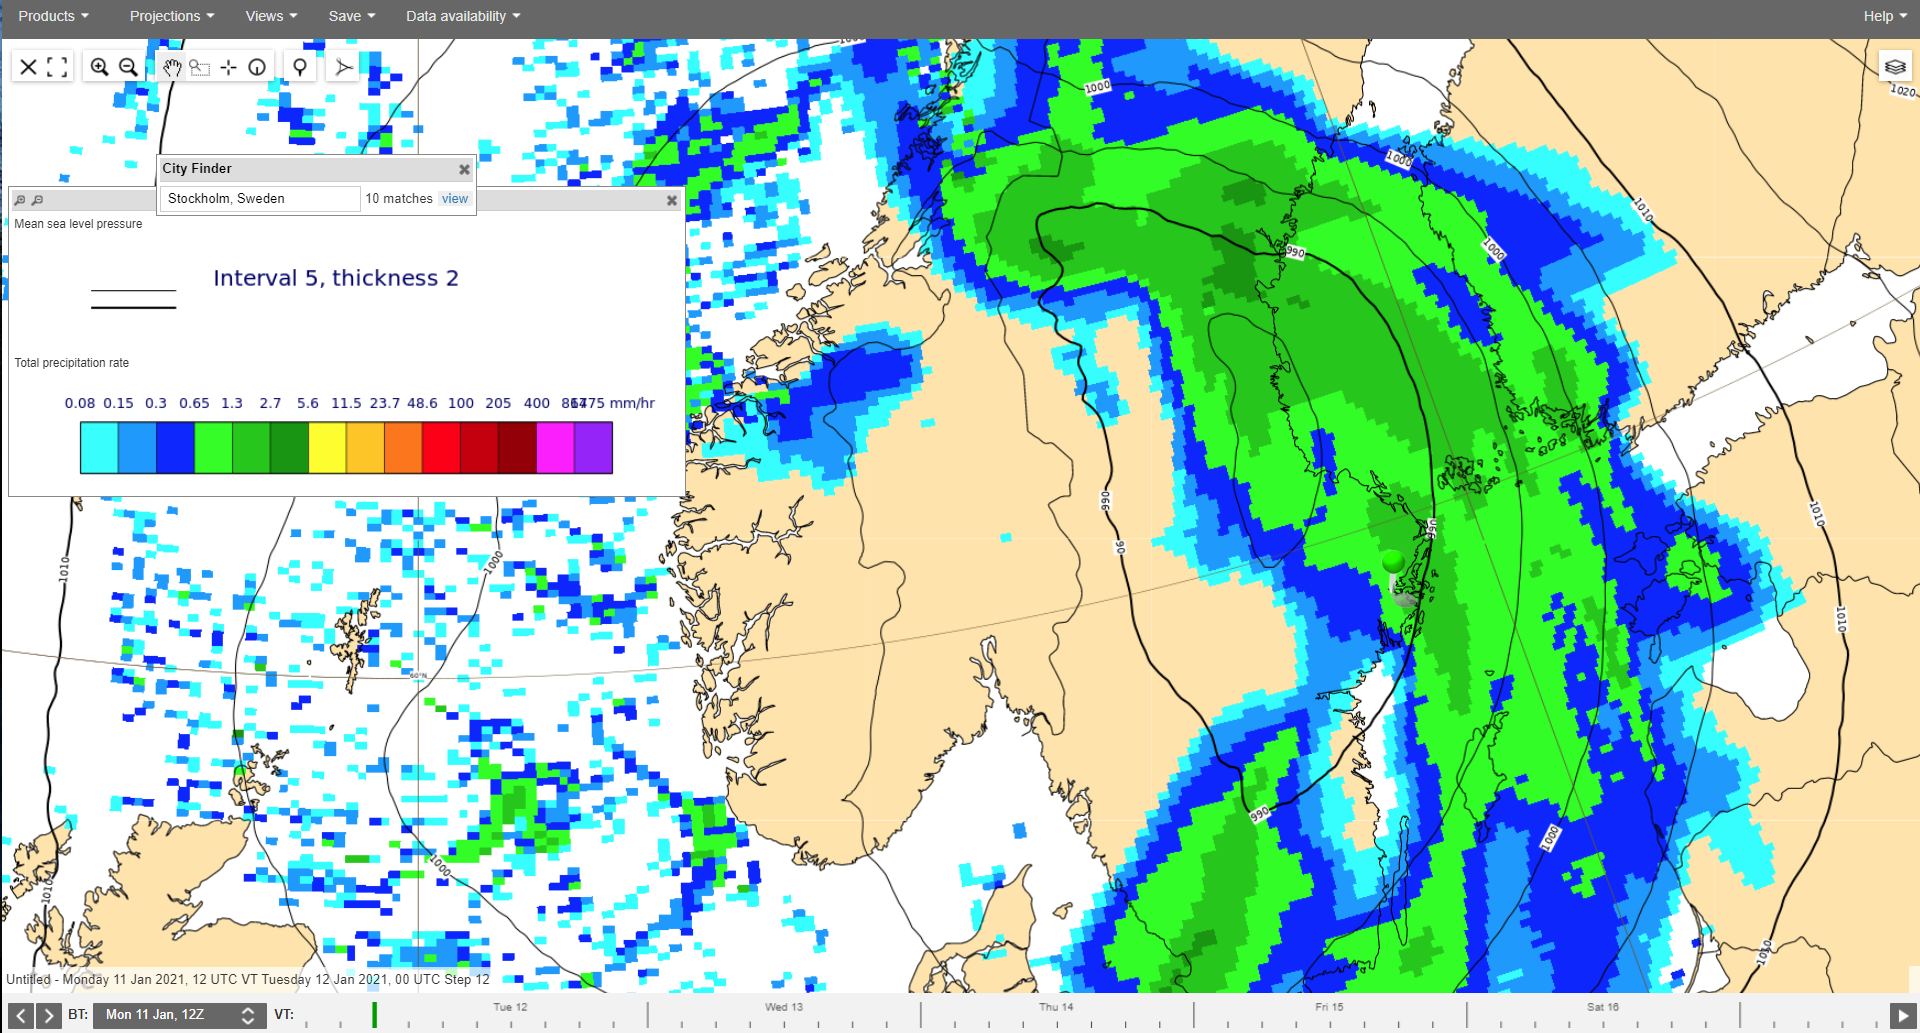
Forecasts from 11 January 12UTC+12 for visibility (left), snowfall rate (middle) and total precipitation rate (right)

Forecasts from 11 January 12UTC+12 for visibility for operational forecast (left, same as above) and for 47r3 experiment (right).


Metars from 3 airports along the Swedish east-coast:
METAR ESNN 112320Z AUTO 10020G33KT 0500
           R16/P2000N R34/P2000N SN
VV007 M00/M00 Q0988= |
...
METAR ESNO 112320Z AUTO 09021G31KT 1000
           R12/P2000N R30/P2000N -SN
           FEW002/// SCT005///
BKN010/// M01/M02 Q0997= |
...
ecPoint
Probability for >20 mm/12h in raw ensemble (left) and
...
ecPoint (right).

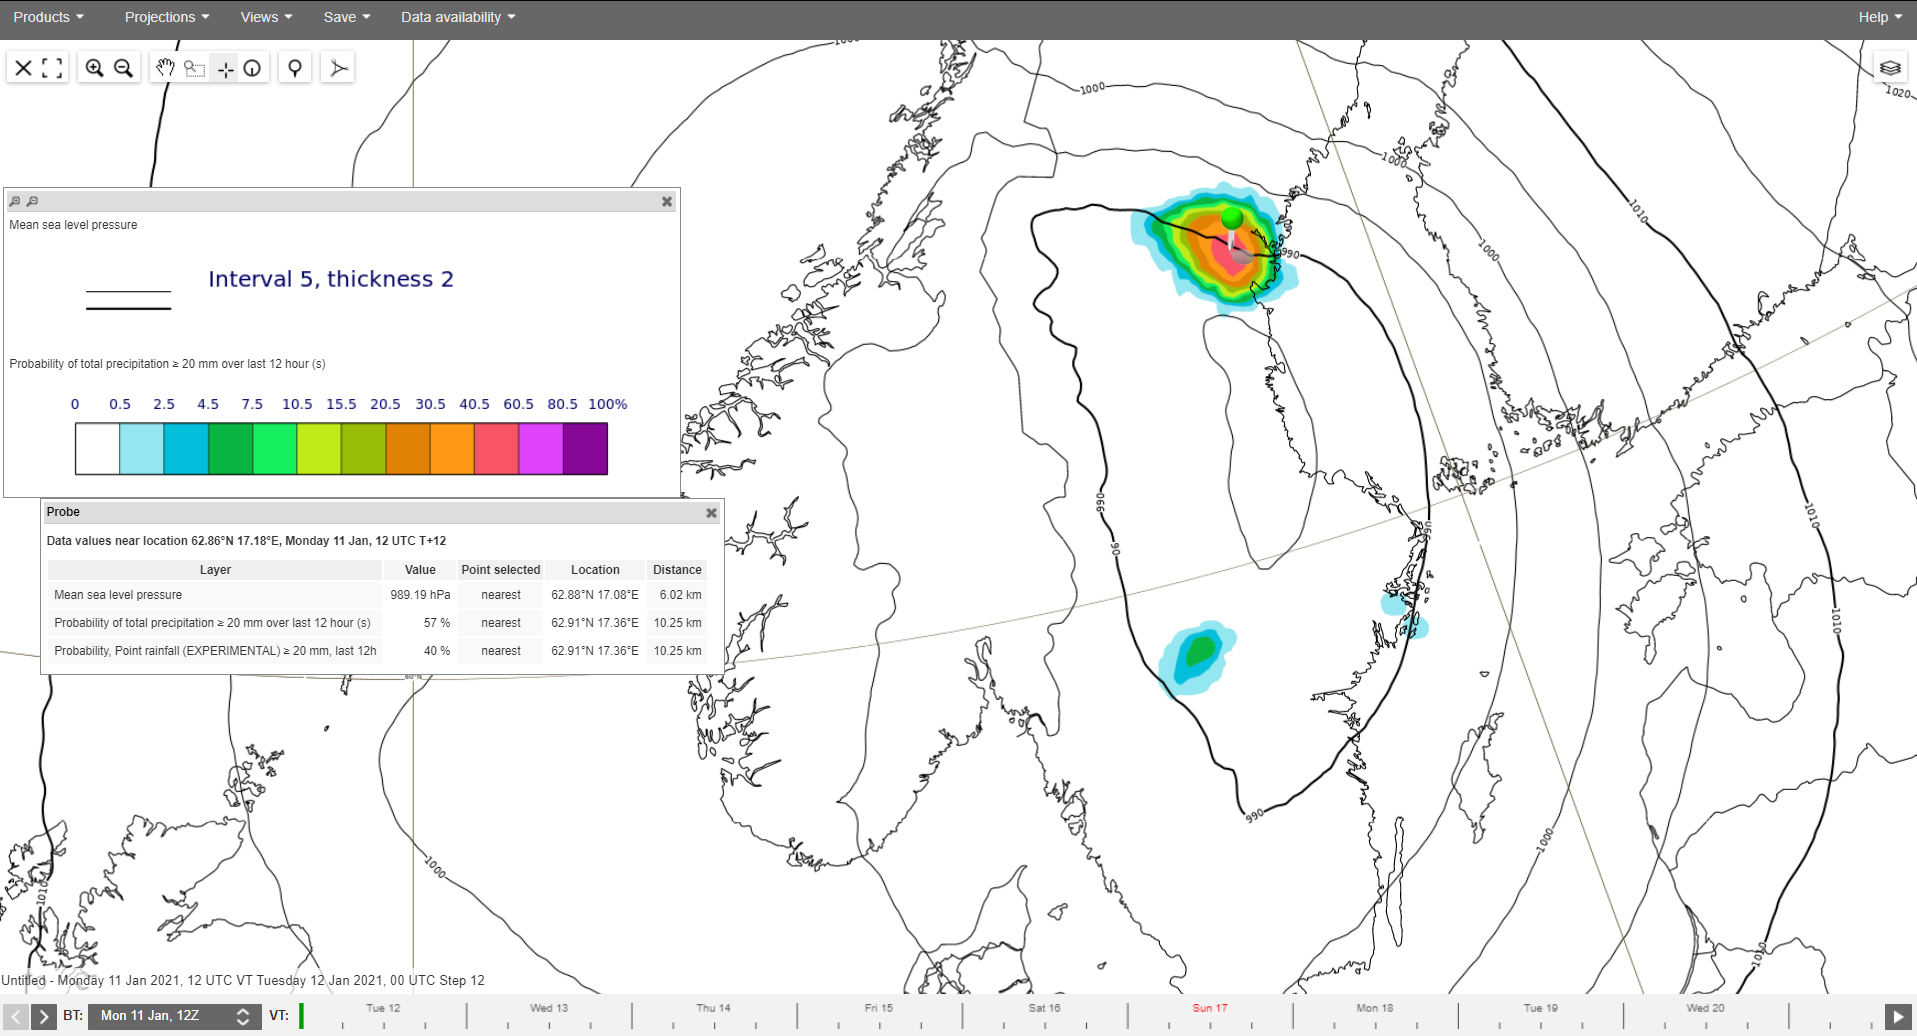
CDF for precipitation for Stockholm (left) and northern point (right)
| View file | ||||
|---|---|---|---|---|
|
| View file | ||||
|---|---|---|---|---|
|
Snow accumulation
Known Forecast Issues S2 and S3.
The plot below shows time-series of various parameters for a point in Southern Sweden in the forecast from 11 January 12UTC and the map for precipitation type for step 12.

2-metre temperature
To evaluate the forecasts for the cold spell that followed after the cyclone, the plot below evaluates the forecasts for 2-metre temperature over southern Sweden 14-16 January, for the region outline in the 1-3 day EFI plot for the same period below. The cold signal started to appear on 28 December.


Seasonal anomalies

