Versions Compared

Key

  • This line was added.
  • This line was removed.
  • Formatting was changed.


Section


Column
width250px40%


Column
width60%


Panel

Objectives


  • Set-up a cartesian projection for the Cross section
  • Configure the axis
  • Load a netCDF file, and understand the information needed by Magics.
  • Apply a shading
  • Position the legend box
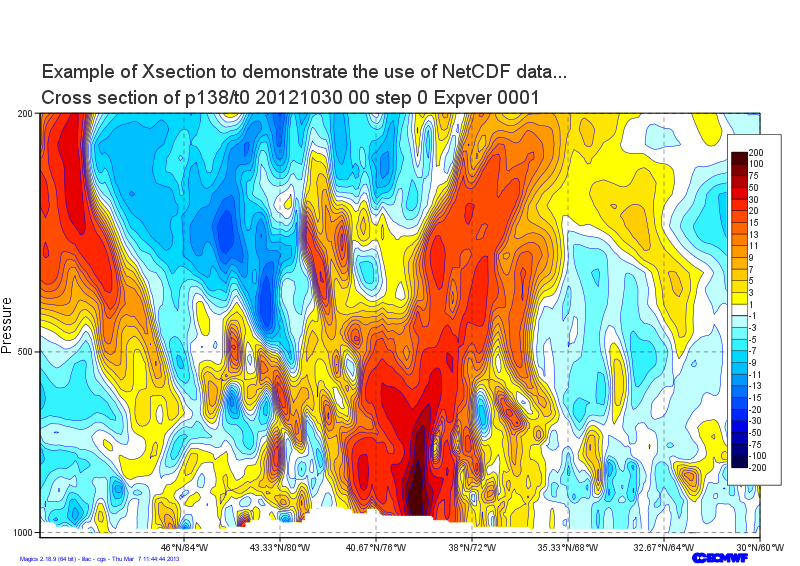
  • Add a text.

You will need to download


...

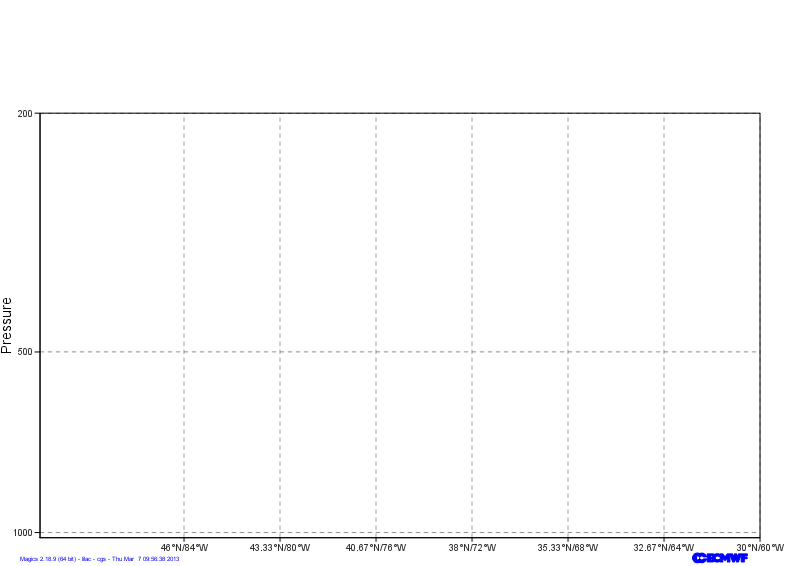
  • The vertical coordinate system is a logarithmic axis from 1000 hPa to 200 hPa.
  • The horizontal coordinate system is a geoline axis from [50oN, 90oW] to  [30oN, 60oW]

Have a look at the  subpage documentation to learn how to setup a cartesian projection .

...

Section


Column
width50%


Info
titleParameters to check

Useful subpage parameters

subpage_map_projection

subpage_x_axis_type
subpage_y_axis_type
subpage_x_min_latitude
subpage_x_min_longitude
subpage_x_max_latitude
subpage_x_max_longitude
subpage_y_min
subpage_y_max


Code Block
language
languagepython
themeConfluencepython
titlePython - Setting a projection
collapsetrue
from Magics.macro import *
#setting the output 
output = output(    
                output_formats = ['png'],
                output_name = "xsect_step1",
                output_name_first_page_number = "off"
        )
# Setting the cartesian view
projection = mmap(
        subpage_map_projection='cartesian',
        subpage_x_axis_type='geoline',
        subpage_y_axis_type='logarithmic',
        subpage_x_min_latitude=50.,
        subpage_x_max_latitude=30.,
        subpage_x_min_longitude=-90.,
        subpage_x_max_longitude=-60.,
        subpage_y_min=1020.,
        subpage_y_max=200.,
        )
# Vertical axis
vertical = maxis(
        axis_orientation='vertical',
        )
# Horizontal axis
horizontal = maxis(
        axis_orientation='horizontal',
        )
        
plot(output, projection, horizontal, vertical)


Column
width200px


...

Section


Column
width50%


Info
titleParameters to check

Useful axis parameters

axis_type

axis_tick_label_height
axis_tick_label_colour
axis_grid
axis_title


Code Block
languagepython
themeConfluence
languagepython
titlePython - adjusting the axis
collapsetrue
from Magics.macro import *
#setting the output 
output = output(    
                output_formats = ['png'],
                output_name = "xsect_step2",
                output_name_first_page_number = "off"
        )
# Setting the cartesian view
projection = mmap(
        subpage_map_projection='cartesian',
        subpage_x_axis_type='geoline',
        subpage_y_axis_type='logarithmic',
        subpage_x_min_latitude=50.,
        subpage_x_max_latitude=30.,
        subpage_x_min_longitude=-90.,
        subpage_x_max_longitude=-60.,
        subpage_y_min=1020.,
        subpage_y_max=200.,
        )
# Vertical axis
vertical = maxis(
        axis_orientation='vertical',
        axis_grid='on',
        axis_type='logarithmic',
        axis_tick_label_height=0.4,
        axis_tick_label_colour='charcoal',
        axis_grid_colour='charcoal',
        axis_grid_line_style='dash',
        axis_title='on',
        axis_title_text='Pressure',
        axis_title_height=0.6,
        )
# Horizontal axis
horizontal = maxis(
        axis_orientation='horizontal',
        axis_type='geoline',
        axis_tick_label_height=0.4,
        axis_tick_label_colour='charcoal',
        axis_grid='on',
        axis_grid_colour='charcoal',
        axis_grid_thickness=1,
        axis_grid_line_style='dash',
        )
plot(output, projection, horizontal, vertical)


Column
width200px


...

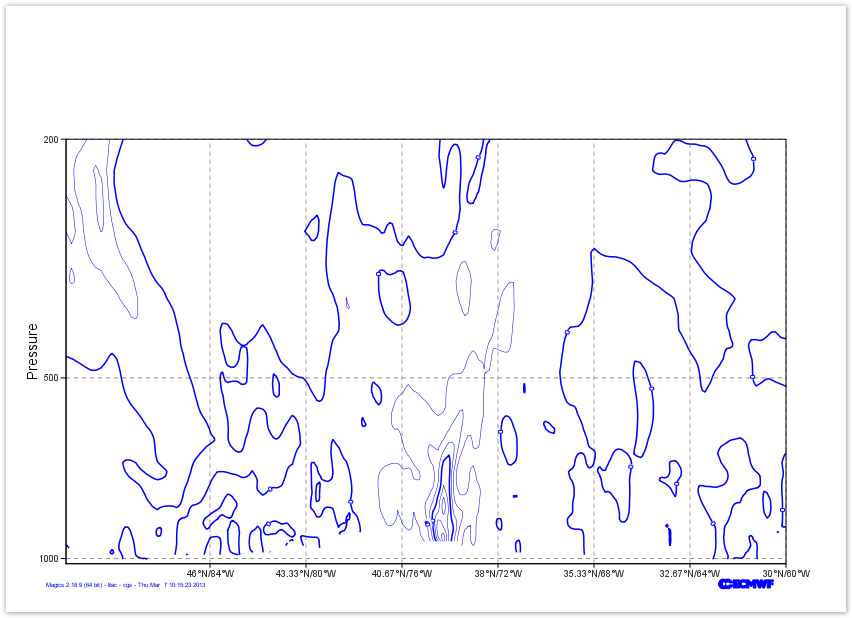
We want to display the variable p1382012103000000000000p13820121030000000000001, and inform Magics that the dimensions of th ematrix the matrix are described in the 2 variables levels and longitude.

...

Section


Column
width50%


Info
titleParameters to check

Useful netCDF parameters

netcdf_filename

netcdf_value_variable
netcdf_field_scaling_factor
netcdf_y_variable
netcdf_x_variable
netcdf_x_auxiliary_variable


Code Block
languagepython
themeConfluencelanguagepython
titlePython - Loading a Netcdf
collapsetrue
from Magics.macro import *
#setting the output 
output = output(    
                output_formats = ['png'],
                output_name = "xsect_step3",
                output_name_first_page_number = "off"
        )
# Setting the cartesian view
projection = mmap(
        subpage_map_projection='cartesian',
        subpage_x_axis_type='geoline',
        subpage_y_axis_type='logarithmic',
        subpage_x_min_latitude=50.,
        subpage_x_max_latitude=30.,
        subpage_x_min_longitude=-90.,
        subpage_x_max_longitude=-60.,
        subpage_y_min=1020.,
        subpage_y_max=200.,
        )
# Vertical axis
vertical = maxis(
        axis_orientation='vertical',
        axis_grid='on',
        axis_type='logarithmic',
        axis_tick_label_height=0.4,
        axis_tick_label_colour='charcoal',
        axis_grid_colour='charcoal',
        axis_grid_thickness=1,
        axis_grid_reference_line_style='solid',
        axis_grid_reference_thickness=1,
        axis_grid_line_style='dash',
        axis_title='on',
        axis_title_text='Pressure',
        axis_title_height=0.6,
        )
# Horizontal axis
horizontal = maxis(
        axis_orientation='horizontal',
        axis_type='geoline',
        axis_tick_label_height=0.4,
        axis_tick_label_colour='charcoal',
        axis_grid='on',
        axis_grid_colour='charcoal',
        axis_grid_thickness=1,
        axis_grid_line_style='dash',
        )
# Definition of the netCDF data and interpretation
data = mnetcdf(netcdf_filename = "section.nc",
      netcdf_value_variable = "p13820121030000000000001",
      netcdf_field_scaling_factor = 100000.,
      netcdf_y_variable = "levels",
      netcdf_x_variable = "longitude",
      netcdf_x_auxiliary_variable = "latitude"
    )
contour = mcont()
plot(output, projection, horizontal, vertical, data, contour)


Column
width200px


...

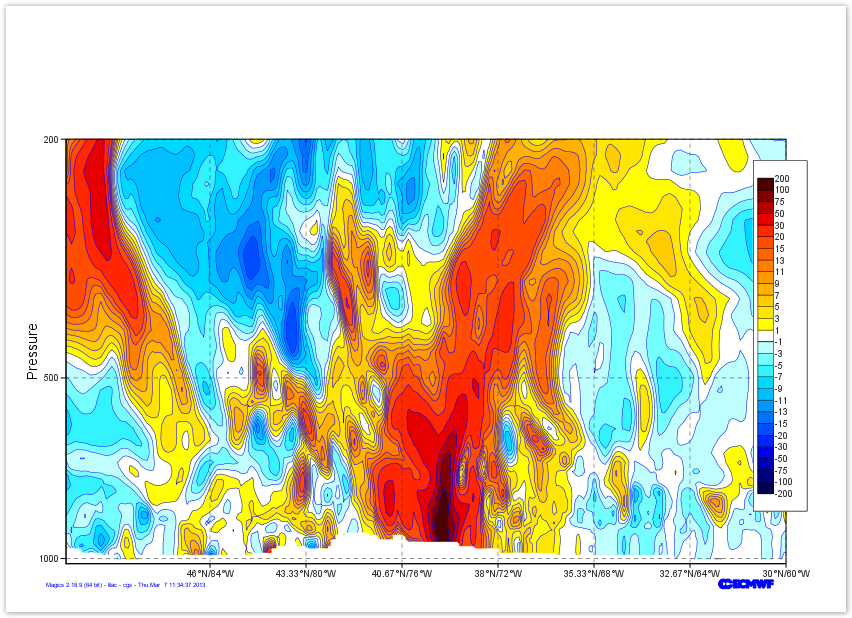
and the list of colours is : ["rgb(0,0,0.3)", "rgb(0,0,0.5)", "rgb(0,0,0.7)", "rgb(0,0,0.9)", "rgb(0,0.15,1)", "rgb(0,0.3,1)", "rgb(0,0.45,1)", "rgb(0,0.6,1)", "rgb(0,0.75,1)", "rgb(0,0.85,1)", "rgb(0.2,0.95,1)", "rgb(0.45,1,1)", "rgb(0.75,1,1)", "none", "rgb(1,1,0)","rgb(1,0.9,0)", "rgb(1,0.8,0)", "rgb(1,0.7,0)", "rgb(1,0.6,0)", "rgb(1,0.5,0)", "rgb(1,0.4,0)", "rgb(1,0.3,0)", "rgb(1,0.15,0)", "rgb(0.9,0,0)", "rgb(0.7,0,0)", "rgb(0.5,0,0)", "rgb(0.3,0,0)"],

Do not forget to trun turn the legend on ...

You could quickly check Contour Documentation

Section


Column
width50%


Info
titleParameters to check

Useful contour parameters

contour_level_selection_type

contour_level_list
contour_shade

contour_shade_method

contour_shade_colour_method

contour_shade_colour_list
legend


Code Block
language
languagepython
themeConfluencepython
titlePython - Using a shading
collapsetrue
from Magics.macro import *
#setting the output 
output = output(    
                output_formats = ['png'],
                output_name = "xsect_step3",
                output_name_first_page_number = "off"
        )
# Setting the cartesian view
projection = mmap(
        subpage_map_projection='cartesian',
        subpage_x_axis_type='geoline',
        subpage_y_axis_type='logarithmic',
        subpage_x_min_latitude=50.,
        subpage_x_max_latitude=30.,
        subpage_x_min_longitude=-90.,
        subpage_x_max_longitude=-60.,
        subpage_y_min=1020.,
        subpage_y_max=200.,
        )
# Vertical axis
vertical = maxis(
        axis_orientation='vertical',
        axis_grid='on',
        axis_type='logarithmic',
        axis_tick_label_height=0.4,
        axis_tick_label_colour='charcoal',
        axis_grid_colour='charcoal',
        axis_grid_thickness=1,
        axis_grid_reference_line_style='solid',
        axis_grid_reference_thickness=1,
        axis_grid_line_style='dash',
        axis_title='on',
        axis_title_text='Pressure',
        axis_title_height=0.6,
        )
# Horizontal axis
horizontal = maxis(
        axis_orientation='horizontal',
        axis_type='geoline',
        axis_tick_label_height=0.4,
        axis_tick_label_colour='charcoal',
        axis_grid='on',
        axis_grid_colour='charcoal',
        axis_grid_thickness=1,
        axis_grid_line_style='dash',
        )
# Definition of the netCDF data and interpretation
data = mnetcdf(netcdf_filename = "section.nc",
      netcdf_value_variable = "p13820121030000000000001",
      netcdf_field_scaling_factor = 100000.,
      netcdf_y_variable = "levels",
      netcdf_x_variable = "longitude",
      netcdf_x_auxiliary_variable = "latitude"
    )
contour = mcont(contour_highlight= "off",
    contour_hilo= "off",
    contour_label= "off",
    legend='on',
    contour_level_list= [-200., -100., -75., -50., -30., -20., 
        -15., -13., -11., -9., -7., -5., -3., -1., 1., 3., 5., 
        7., 9., 11., 13., 15., 20., 30., 50., 75., 100., 200],
    contour_level_selection_type= "level_list",
    contour_shade= "on",
    contour_shade_colour_list= ["rgb(0,0,0.3)", "rgb(0,0,0.5)", 
        "rgb(0,0,0.7)", "rgb(0,0,0.9)", "rgb(0,0.15,1)", 
        "rgb(0,0.3,1)", "rgb(0,0.45,1)", "rgb(0,0.6,1)", 
        "rgb(0,0.75,1)", "rgb(0,0.85,1)", "rgb(0.2,0.95,1)", 
        "rgb(0.45,1,1)", "rgb(0.75,1,1)", "none", "rgb(1,1,0)", 
        "rgb(1,0.9,0)", "rgb(1,0.8,0)", "rgb(1,0.7,0)", 
        "rgb(1,0.6,0)", "rgb(1,0.5,0)", "rgb(1,0.4,0)", 
        "rgb(1,0.3,0)", "rgb(1,0.15,0)", "rgb(0.9,0,0)", 
        "rgb(0.7,0,0)", "rgb(0.5,0,0)", "rgb(0.3,0,0)"],
    contour_shade_colour_method= "list",
    contour_shade_method= "area_fill")
plot(output, projection, horizontal, vertical, data, contour)


Column
width200px


...

Section


Column
width50%


Info
titleParameters to check

Useful legend parameters

legend

legend_display_type

legend_box_mode

legend_box_x_position

legend_box_y_position

legend_box_x_length

legend_box_y_length
legend_box_blanking
legend_border


Code Block
language
languagepython
themeConfluencepython
titlePython - Position the legend
collapsetrue
from Magics.macro import *
#setting the output 
output = output(    
                output_formats = ['png'],
                output_name = "xsect_step5",
                output_name_first_page_number = "off"
        )
# Setting the cartesian view
projection = mmap(
        subpage_map_projection='cartesian',
        subpage_x_axis_type='geoline',
        subpage_y_axis_type='logarithmic',
        subpage_x_min_latitude=50.,
        subpage_x_max_latitude=30.,
        subpage_x_min_longitude=-90.,
        subpage_x_max_longitude=-60.,
        subpage_y_min=1020.,
        subpage_y_max=200.,
        )
# Vertical axis
vertical = maxis(
        axis_orientation='vertical',
        axis_grid='on',
        axis_type='logarithmic',
        axis_tick_label_height=0.4,
        axis_tick_label_colour='charcoal',
        axis_grid_colour='charcoal',
        axis_grid_thickness=1,
        axis_grid_reference_line_style='solid',
        axis_grid_reference_thickness=1,
        axis_grid_line_style='dash',
        axis_title='on',
        axis_title_text='Pressure',
        axis_title_height=0.6,
        )
# Horizontal axis
horizontal = maxis(
        axis_orientation='horizontal',
        axis_type='geoline',
        axis_tick_label_height=0.4,
        axis_tick_label_colour='charcoal',
        axis_grid='on',
        axis_grid_colour='charcoal',
        axis_grid_thickness=1,
        axis_grid_line_style='dash',
        )
# Definition of the netCDF data and interpretation
data = mnetcdf(netcdf_filename = "section.nc",
      netcdf_value_variable = "p13820121030000000000001",
      netcdf_field_scaling_factor = 100000.,
      netcdf_y_variable = "levels",
      netcdf_x_variable = "longitude",
      netcdf_x_auxiliary_variable = "latitude"
    )
contour = mcont(contour_highlight= "off",
    contour_hilo= "off",
    contour_label= "off",
    legend='on',
    contour_level_list= [-200., -100., -75., -50., -30., -20., 
        -15., -13., -11., -9., -7., -5., -3., -1., 1., 3., 5., 
        7., 9., 11., 13., 15., 20., 30., 50., 75., 100., 200],
    contour_level_selection_type= "level_list",
    contour_shade= "on",
    contour_shade_colour_list= ["rgb(0,0,0.3)", "rgb(0,0,0.5)", 
        "rgb(0,0,0.7)", "rgb(0,0,0.9)", "rgb(0,0.15,1)", 
        "rgb(0,0.3,1)", "rgb(0,0.45,1)", "rgb(0,0.6,1)", 
        "rgb(0,0.75,1)", "rgb(0,0.85,1)", "rgb(0.2,0.95,1)", 
        "rgb(0.45,1,1)", "rgb(0.75,1,1)", "none", "rgb(1,1,0)", 
        "rgb(1,0.9,0)", "rgb(1,0.8,0)", "rgb(1,0.7,0)", 
        "rgb(1,0.6,0)", "rgb(1,0.5,0)", "rgb(1,0.4,0)", 
        "rgb(1,0.3,0)", "rgb(1,0.15,0)", "rgb(0.9,0,0)", 
        "rgb(0.7,0,0)", "rgb(0.5,0,0)", "rgb(0.3,0,0)"],
    contour_shade_colour_method= "list",
    contour_shade_method= "area_fill")
legend = mlegend(legend='on', 
    legend_display_type='continuous', 
    legend_text_colour='charcoal',         
    legend_text_font_size=0.4, 
    legend_box_mode = "positional",
    legend_box_x_position = 27.00,
    legend_box_y_position = 3.00,
    legend_box_x_length = 2.00,
    legend_box_y_length = 13.00,
    legend_box_blanking = "on",
    legend_border = "on",
    legend_border_colour='charcoal')
 plot(output, projection, horizontal, vertical, data, contour, legend)


Column
width200px


...

Section


Column
width50%


Info
titleParameters to check

Useful Text parameters

text_lines

text_font_size
text_colour
text_font_style


Code Block
languagepython
themeConfluencelanguagepython
titlePython - Position the legend
collapsetrue
from Magics.macro import *
#setting the output 
output = output(    
                output_formats = ['png'],
                output_name = "xsect_step6",
                output_name_first_page_number = "off"
        )
# Setting the cartesian view
projection = mmap(
        subpage_map_projection='cartesian',
        subpage_x_axis_type='geoline',
        subpage_y_axis_type='logarithmic',
        subpage_x_min_latitude=50.,
        subpage_x_max_latitude=30.,
        subpage_x_min_longitude=-90.,
        subpage_x_max_longitude=-60.,
        subpage_y_min=1020.,
        subpage_y_max=200.,
        )
# Vertical axis
vertical = maxis(
        axis_orientation='vertical',
        axis_grid='on',
        axis_type='logarithmic',
        axis_tick_label_height=0.4,
        axis_tick_label_colour='charcoal',
        axis_grid_colour='charcoal',
        axis_grid_thickness=1,
        axis_grid_reference_line_style='solid',
        axis_grid_reference_thickness=1,
        axis_grid_line_style='dash',
        axis_title='on',
        axis_title_text='Pressure',
        axis_title_height=0.6,
        )
# Horizontal axis
horizontal = maxis(
        axis_orientation='horizontal',
        axis_type='geoline',
        axis_tick_label_height=0.4,
        axis_tick_label_colour='charcoal',
        axis_grid='on',
        axis_grid_colour='charcoal',
        axis_grid_thickness=1,
        axis_grid_line_style='dash',
        )
# Definition of the netCDF data and interpretation
data = mnetcdf(netcdf_filename = "section.nc",
      netcdf_value_variable = "p13820121030000000000001",
      netcdf_field_scaling_factor = 100000.,
      netcdf_y_variable = "levels",
      netcdf_x_variable = "longitude",
      netcdf_x_auxiliary_variable = "latitude"
    )
contour = mcont(contour_highlight= "off",
    contour_hilo= "off",
    contour_label= "off",
    legend='on',
    contour_level_list= [-200., -100., -75., -50., -30., -20., 
        -15., -13., -11., -9., -7., -5., -3., -1., 1., 3., 5., 
        7., 9., 11., 13., 15., 20., 30., 50., 75., 100., 200],
    contour_level_selection_type= "level_list",
    contour_shade= "on",
    contour_shade_colour_list= ["rgb(0,0,0.3)", "rgb(0,0,0.5)", 
        "rgb(0,0,0.7)", "rgb(0,0,0.9)", "rgb(0,0.15,1)", 
        "rgb(0,0.3,1)", "rgb(0,0.45,1)", "rgb(0,0.6,1)", 
        "rgb(0,0.75,1)", "rgb(0,0.85,1)", "rgb(0.2,0.95,1)", 
        "rgb(0.45,1,1)", "rgb(0.75,1,1)", "none", "rgb(1,1,0)", 
        "rgb(1,0.9,0)", "rgb(1,0.8,0)", "rgb(1,0.7,0)", 
        "rgb(1,0.6,0)", "rgb(1,0.5,0)", "rgb(1,0.4,0)", 
        "rgb(1,0.3,0)", "rgb(1,0.15,0)", "rgb(0.9,0,0)", 
        "rgb(0.7,0,0)", "rgb(0.5,0,0)", "rgb(0.3,0,0)"],
    contour_shade_colour_method= "list",
    contour_shade_method= "area_fill")
legend = mlegend(legend='on', 
    legend_display_type='continuous', 
    legend_text_colour='charcoal',         
    legend_text_font_size=0.4, 
    legend_box_mode = "positional",
    legend_box_x_position = 27.00,
    legend_box_y_position = 3.00,
    legend_box_x_length = 2.00,
    legend_box_y_length = 13.00,
    legend_box_blanking = "on",
    legend_border = "on",
    legend_border_colour='charcoal')
title = mtext(
        text_lines= ['Example of Xsection to demonstrate the use of netCDF data...', 
        '<magics_title/>'],
        text_html= 'true',
        text_justification= 'left',
        text_font_size= 0.8,
        text_colour= 'charcoal',
        )

plot(output, projection, horizontal, vertical, data, contour, legend, title)


Column
width200px


...