...
| Panel | ||||||
|---|---|---|---|---|---|---|
| ||||||
For these tasks, use the metview icons in the row labelled 'Analysis' an_1x1.mv : this plots horizontal maps of parameters from the ECMWF analyses overlaid on one plot. an_2x2.mv : this plots horizontal maps of parameters from the ECMWF analyses four plots to a page (two by two). an_xs.mv : this plots vertical cross-sections of parameters from the ECMWF analyses. |
...
HRES data is provided at the same resolution as the operational model, in order to give the best representation of the Hurricane and cut-off low interationsiterations. This may mean that some plotting will be slow.
...
Task 5: Cumulative distribution function
Recap
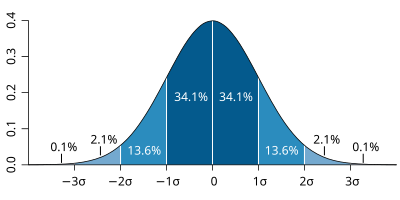
| The probability distribution function of the normal distribution or Gaussian distribution. The probabilities expressed as a percentage for various widths of standard deviations (σ) represent the area under the curve. |
|---|
Figure from Wikipedia. |
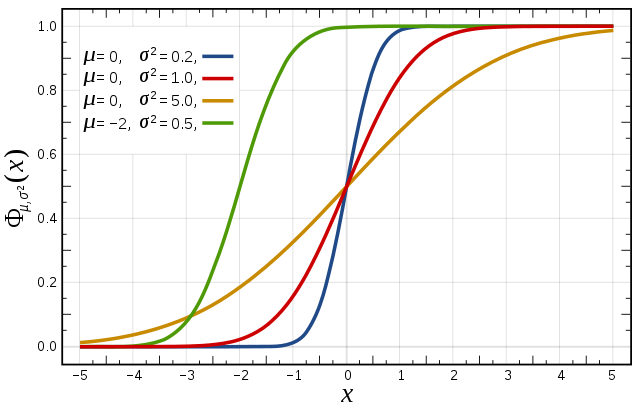
Cumulative distribution function for a normal |
|---|
Figure from Wikipedia. |
Cumulative distribution function (CDF)
...
| Panel | ||||||
|---|---|---|---|---|---|---|
| ||||||
The different macros available for this exercise are very similar to those in previous exercises. For this exercise, use the icons in the row labelled 'Experiments'. These work in a similar way to the previous exercises. ens_exps_rmse.mv : this will produce RMSE plumes for all the above experiments and the operational ensemble. ens_exps_to_an.mv : this produces 4 plots showing the ensemble spread from the OpenIFS experiments compared to the analysis. ens_exps_to_an_spag.mv : this will produce spaghetti maps for a particular parameter contour value compared to the analysis. ens_part_to_all.mv : this allows the spread & mean of a subset of the ensemble members to be compared to the whole ensemble. |
...


