| Section |
|---|
| Column |
|---|
IntroductionThe ECMWF operational ensemble forecasts for the western Mediterranean region exhibited high uncertainty while Hurricane Nadine was slowly moving over the eastern N.Atlantic in Sept. 2012. Interaction with an Atlantic cut-off low produced a bifurcation in the ensemble and significant spread, which controls both the track of Hurricane Nadine and the synoptic conditions downstream. The HyMEX (Hydrological cycle in Mediterranean eXperiment) field campaign was also underway and forecast uncertainty was a major issue for planning observations during the first special observations period of the campaign. This interesting case study examines the forecasts in the context of the interaction between Nadine and the Atlantic cut-off low in the context of ensemble forecasting. It will explore the scientific rationale for using ensemble forecasts, why they are necessary and they can be interpreted, particularly in a "real world" situation of forecasting for a observational field campaign. | Panel |
|---|
| title | This case study is based on the following paper which is recommended reading |
|---|
| Pantillon, F., Chaboureau, J.-P. and Richard, E. (2015), 'Vortex-vortex interaction between Hurricane Nadine and an Atlantic cutoff dropping the predictability over the Mediterranean, http://onlinelibrary.wiley.com/doi/10.1002/qj.2635/abstract |
In this case studyIn the exercises for this interesting case study we will: - Study the development of Hurricane Nadine and the interaction with the Atlantic cut-off low using the ECMWF analyses.
- Study the performance of the ECMWF high resolution (HRES) deterministic forecast of the time.
- Use the operational ensemble forecast to look at the forecast spread and understand the uncertainty downstream of the interaction.
- Compare a reforecast using the current (the May/2016 ) ECMWF operational ensemble with the 2012 ensemble forecasts.
- Use principal component analysis (PCA) with clustering techniques (see Pantillon et al) to characterize the behaviour of the ensembles.
- See how forecast products were used during the HyMEX field campaign.
|
|
...
| Info |
|---|
|
- Study synoptic conditions over the N.Atlantic and Europe during the approach of Hurricane Nadine and interaction with N.Atlantic cut-off low.
|
Hurricane Nadine and the cut-off low
...
Task 1: Mean-sea-level pressure and track
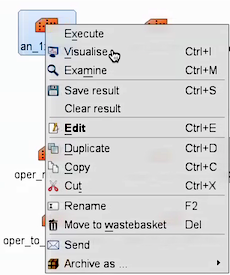
Plot. Right-click the mouse button on the 'an_1x1.mv' icon and select the 'Visualise' menu item (see figure right)
After a pause, this will generate a map showing mean-sea-level pressure (MSLP).

Now drag Plot track of Nadine. Drag the mv_track.mv icon onto the map. This will add the track of Hurricane Nadine. Although the full track of the tropical storm is shown from the 10-09-2012 to 04-10-2016, the ECMWF analyses (for the purpose of this study) only show 15-09-2012 to 25-09-2012.
...
| Panel |
|---|
|
With the edit window open, find the line that defines 'plot1': | Code Block |
|---|
| #Define plot list (min 1- max 4)
plot1=["mslp"] # use square brackets when overlaying multiple fields per plot |
Change this line to: | Code Block |
|---|
plot1=["z500.s","mslp"] |
The suffix '.s' means plot the 500hPa geopotential as a shaded plot instead of using contours (this style is not available for all fields). |
...
Click the play button and then animate the map that appears. |
...
| Panel |
|---|
|
Change the value of "plot1" again to animate the PV at 320K (similar to Figure 13 in Pantillon et al). |
| Panel |
|---|
| borderColor | red |
|---|
| title | Questions |
|---|
|
Compare an animation of the z500 and mslp fields with Figure 1. from Pantillon et al. 1. When does the cut-off low form (see z500)? 2. How close do Nadine and the cut-off low get in the analyses? 3. Instead of z500, plot From the PV at 320K (similar to Fig.13 in Pantillon). What and z500), what is different about the upper level structure of Nadine and the cut-off low? |
...

