...
Task 1: Mean-sea-level pressure and track
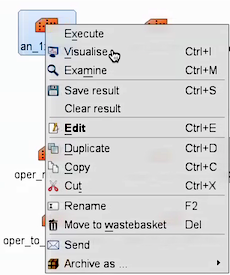
Right-click the mouse button on the 'an_1x1.mv' icon and select the 'Visualise' menu item (see figure right)
After a pause, this will generate a map showing mean-sea-level pressure (MSLP).
Now drag the mv_track.mv icon onto the map. This will add the track of Nadine. Note that although the track shows the full track of the tropical storm from the 10-09-2012 to 04-10-2016, the ECMWF analyses (for the purpose of this study) only show 15-09-2012 to 25-09-2012.
In the plot window, use the play button in the animation controls to animate the map and follow the development and track of Hurricane Nadine.
You can use the 'Speed' menu to change the animation speed (each frame is every 6 hours).
- Plot and animate MSL + 500hPa maps showing track of Nadine
> 1 : Nadine MSLP and T2m (or better SST) tracking 15-20 september
> 2 : Satellite views on the 20th (provided by Etienne, if possible to put on the VM)
> 3 : Studying of the horizontal maps (analysis + forecasts)
> 4 : Studying and building of the vertical x-sections (analysis + forecasts)
> 5 : Beyond D+5 deterministic scenario : MSLP only
Notes from Frederic: email 7/4/16
...
Maybe we can put the students into the role of the forecaster during HyMEX; given the CDF plots & clusters, what would the students have decided to do and why?
We did this last year asking the question what would the participants do if the Queen had a birthday garden party and the forecast showed a risk of severe weather It was a good discussion.
Perhaps this could be led by Etienne based on Hymex experience?
Task 4 : PCA and clustering
...


