...
Animate the plots in the display window by clicking 
| Info | ||
|---|---|---|
| ||
For |
For the an_2x2.mv icon the number of maps appearing in the plot layout can be 1, 2, 3 or 4. This is true of all the icons labelled '2x2'.
an_2x2.mv demonstrates how to plot a four-map layout in a similar fashion to the one-map layout. The only difference here is that you need to define four plots instead of one.
Right-click on the icon and select 'Edit'. Change the plot layout like this:
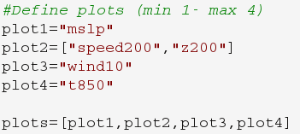
Note how some plots can be single parameters whilst others can be overlays of two (or more) fields.
Wind parameters can be shown either as arrows or as feather by adding '_f' to the variable name.
Two map types are available covering a different area.
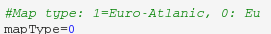
With mapType=0, the map will cover a smaller geographical area centred on the UK.
With mapType=1, the map will cover most of the North Atlantic
Exercise 2: The operational HRES forecast
...