...
| Note | ||||||||||||||||||||||
|---|---|---|---|---|---|---|---|---|---|---|---|---|---|---|---|---|---|---|---|---|---|---|
| ||||||||||||||||||||||
|


| Panel | ||||||||||
|---|---|---|---|---|---|---|---|---|---|---|
| ||||||||||
Icon ' Icon
|
...
Exercise 2: Visualise operational HRES forecast
| Panel | ||||||
|---|---|---|---|---|---|---|
| ||||||
The ECMWF operational deterministic forecast is called HRES. The model runs at a spectral resolution of T1279, equivalent to 16km grid spacing. Only a single forecast is run at this resolution as the computational resources required are demanding. The ensemble forecasts are run at a lower resolution. Before looking at the ensemble forecasts, first understand the performance of the operational HRES forecast. |
| Panel | ||||||
|---|---|---|---|---|---|---|
| ||||||
Data is provided for multiple forecasts starting from different dates, known as different lead times. Available lead times for October 2013 are: 24th, 25th, 26th and 27th. Some tasks will use all the lead times, others require only one. |
| Panel | ||||||
|---|---|---|---|---|---|---|
| ||||||
For this task, use the metview icons in the row labelled 'Oper forecast'
oper_rmse.mv : this plots the root-mean-square-error growth curves for the operational HRES forecast for the different lead times.
oper_to_an_runs.mv : this plots the same parameter from the different forecasts for the same verifying time. Use this to understand how the forecasts differed, particularly for the later forecasts closer to the event. oper_to_an_diff.mv : this plots a single parameter as a difference between the operational HIRES forecast and the ECMWF analysis. Use this to understand the forecast errors from the different lead times.
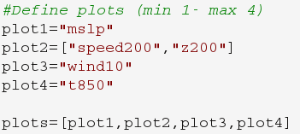
Parameters & map appearance. These macros have the same choice of parameters to plot and same choice of |
...