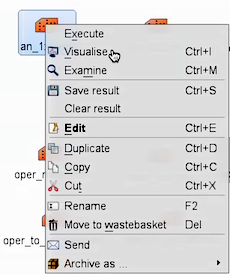
Right-click the mouse button on the 'an_1x1.mv' icon and select the 'Visualise' menu item (see figure right) After a few seconds, this will generate a map showing two parameters: mean-sea-level pressure (MSLP) and 3hrly max wind-gust at 10m (wgust10). Use the play button  Image Added to animate the map and follow the development and track of the storm. Image Added to animate the map and follow the development and track of the storm. You can use the 'Speed' menu to change the animation speed (each frame is every 3 hours). |