...
Objective: Understanding the formation of the storm
Please see the map of wind observations in handout.
Starting up metview
| Code Block |
|---|
| title | Type the following command in a terminal window |
|---|
|
metview |
...
| Panel |
|---|
| bgColor | white |
|---|
| titleBGColor | lightlightgrey |
|---|
| title | Metview icons |
|---|
|
For this task, use the metview icons in the row labelled 'Analysis'  Image Added Image Added |
| Panel |
|---|
| bgColor | white |
|---|
| titleBGColor | lightlightgrey |
|---|
| title | Plot analyses in various layouts |
|---|
|
Icon 'an_1x1.mv' produces a single plot on the page. Icon 'an_2x2.mv' can produce up to 4 plots per page. | Info |
|---|
| For the 'an_1x1.mv' icon, the plot contents can be changed by editing the plot1 variable in the macro. By default the 10m wind is shown. To alter the plotted field, right-click and choose 'Edit'. It is possible to overlay multiple fields like this: 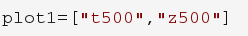
You will find a list of available parameters in the macro. After editing the macro text, you can optionally save using the 'File' menu and 'Save'. Display the plot by clicking:  Animate the plots in the display window by clicking |
| Info |
|---|
| title | Change plot appearance |
|---|
| The number of maps appearing in the plot layout can be 1, 2, 3 or 4. Macro an_2x2.mv demonstrates how to plot a four-map layout in a similar fashion to the one-map layout. The only difference here is that you need to define four plots instead of one. Right-click on the icon and select 'Edit'. Change the plot layout like this: 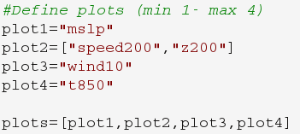
Two map types are available covering a different area. 
With mapType=0, the map will cover a smaller geographical area centred on the UK. With mapType=1, the map will cover most of the North Atlantic |
|
...