...
The plots above shows the probability for more than 100 mm during the 72-hour period (3-6 September) from forecasts with different initial times.
Gallery includeLabel efi3 sort comment title EFI for 3-day precipitation
The plots above shows the EFI and SOT for 3-day accumulation of precipitation.
3.4 Monthly forecasts
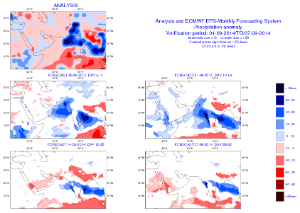
The figure above shows the ensemble mean anomalies for the week 1-7 September from different monthly forecasts, including the analysis (top panel).
...
