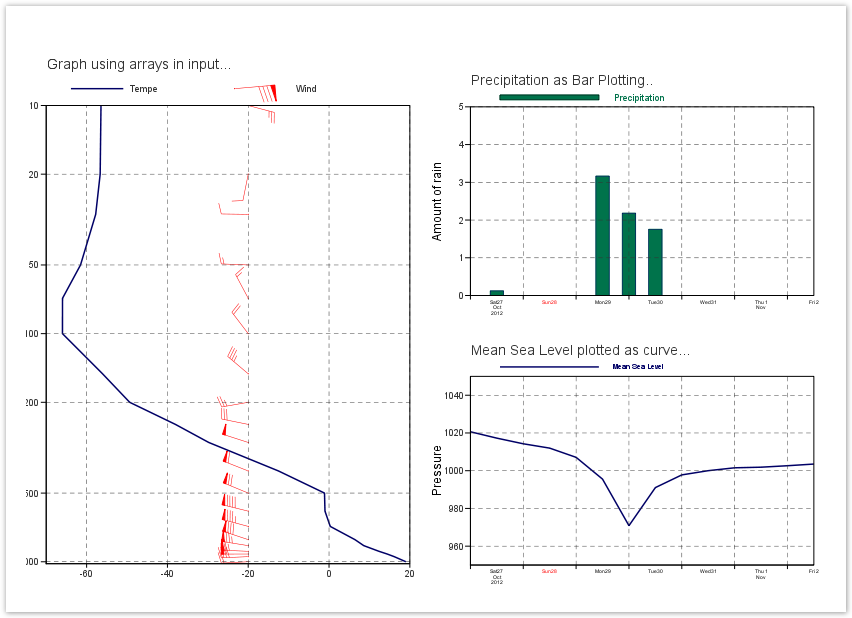
We can pass these arrays to Magics using the minput object . Check the Input Data Documentation for more information about the parameters. Note that we want to use Celsius in our graph...
The mgraph object can then be used to preform the visualisation. All the parameters can be found in the Graph Plotting Page.