ECMWF logo Support Portal
changes.mady.by.user Sylvie Lamy-Thepaut
Saved on Mar 07, 2013
...
subpage_map_projection
axis_grid_reference
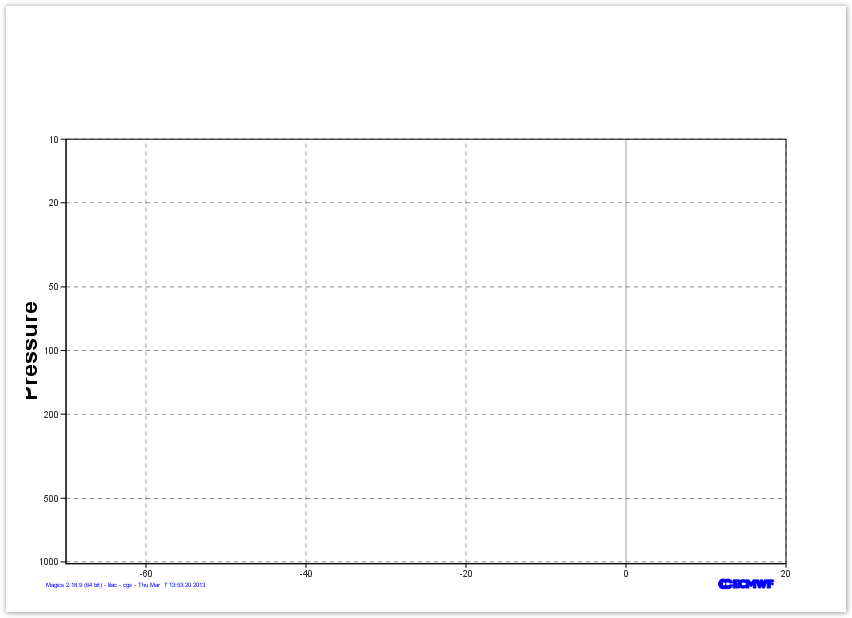
# importing Magics module
from Magics.macro import *
# define the output
output = output(output_formats=['png'],
        output_name_first_page_number='off',
        output_name="profile_step1")
projection = mmap(
    subpage_map_projection='cartesian',
    subpage_x_axis_type='regular',
    subpage_y_axis_type='logarithmic',
    subpage_x_min=-70.,
    subpage_x_max=20.,
    subpage_y_min=1020.,
    subpage_y_max=10.,)
#define the vertical axis
vertical = maxis(
    axis_orientation='vertical',
    axis_grid='on',
    axis_type='logarithmic',
    axis_tick_label_height=0.4,
    axis_tick_label_colour='charcoal',
    axis_grid_colour='charcoal',
    axis_grid_line_style='dash',
    axis_title='on',
    axis_title_text='Pressure',
    axis_title_font='arial',
    axis_title_font_style='bold',
    axis_title_height=1.,
    )
# define the horizontal axis
horizontal = maxis(
    axis_orientation='horizontal',
    axis_type='regular',
    axis_tick_label_height=0.4,
    axis_tick_label_colour='charcoal',
    axis_grid='on',
    axis_grid_colour='charcoal',
    axis_grid_thickness=1,
    axis_grid_reference_level=0.,
    axis_grid_reference_line_style='solid',
    axis_grid_reference_thickness=1,
    axis_grid_line_style='dash',)

plot(output, projection, vertical, horizontal)
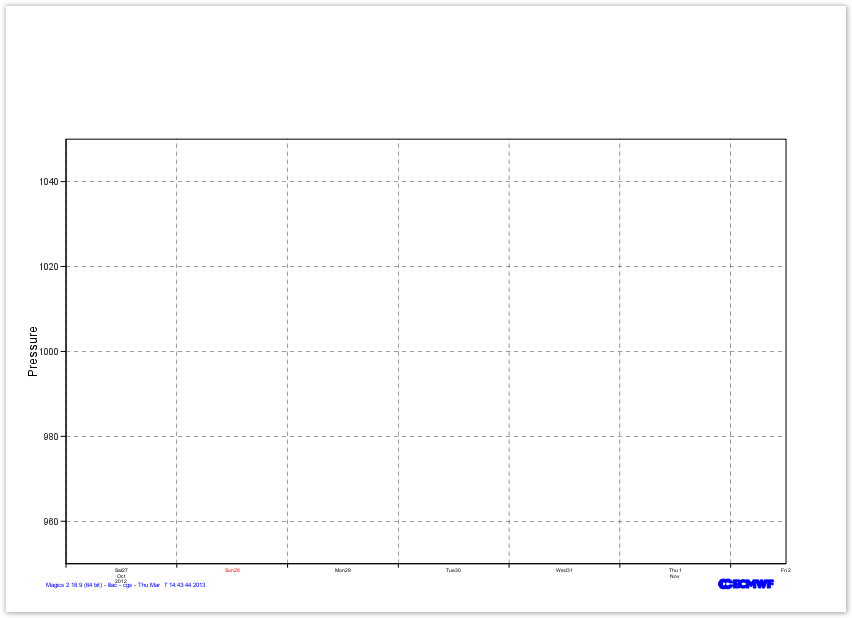
 # importing Magics module
from Magics.macro import *
# define the output
output = output(output_formats=['png'],
        output_name_first_page_number='off',
        output_name="time_serie_step1")
projection = mmap(
    subpage_map_projection='cartesian',
    subpage_x_axis_type='date',
    subpage_y_axis_type='regular',
    subpage_x_date_min='2012-10-27 00:00:00',
    subpage_x_date_max='2012-11-02 12:00:00',
    subpage_y_max=1050.,
    subpage_y_min=950.,
    )
# Vertical axis
vertical = maxis(
    axis_orientation='vertical',
    axis_grid='on',
    axis_type='regular',
    axis_tick_label_height=0.4,
    axis_tick_label_colour='charcoal',
    axis_grid_colour='charcoal',
    axis_grid_thickness=1,
    axis_grid_reference_level=0.,
    axis_grid_reference_line_style='solid',
    axis_grid_reference_thickness=1,
    axis_grid_line_style='dash',
    axis_title='on',
    axis_title_text='Pressure',
    axis_title_font='arial',
    axis_title_height=0.5,
    )
# Horizontal axis
horizontal = maxis(
    axis_orientation='horizontal',
    axis_type='date',
    axis_tick_label_height=0.4,
    axis_tick_label_colour='charcoal',
    axis_grid='on',
    axis_grid_colour='charcoal',
    axis_grid_thickness=1,
    axis_grid_line_style='dash',
    )

plot(output, projection, horizontal, vertical)
table_filename
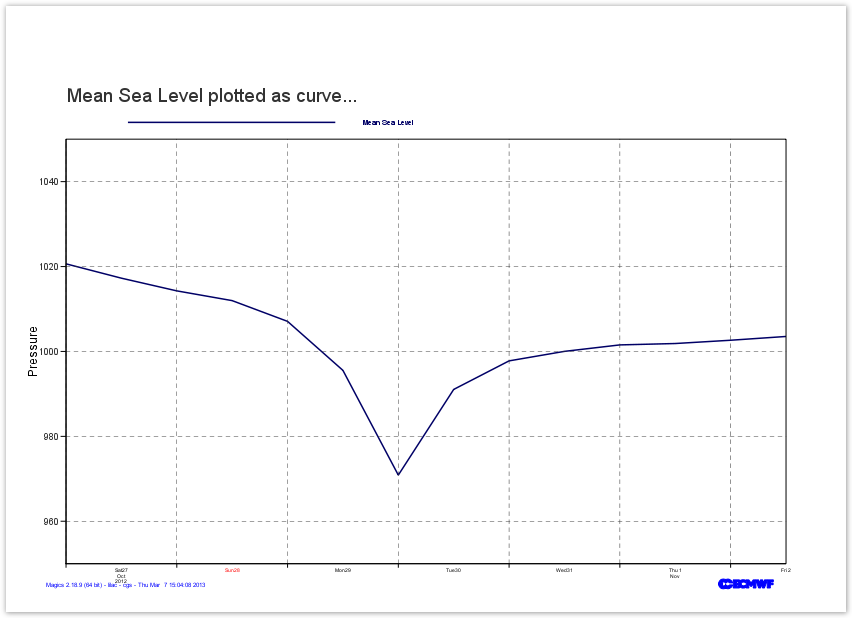
# importing Magics module
from Magics.macro import *
# define the output
output = output(output_formats=['png'],
        output_name_first_page_number='off',
        output_name="time_serie_step2")
projection = mmap(
    subpage_map_projection='cartesian',
    subpage_x_axis_type='date',
    subpage_y_axis_type='regular',
    subpage_x_date_min='2012-10-27 00:00:00',
    subpage_x_date_max='2012-11-02 12:00:00',
    subpage_y_max=1050.,
    subpage_y_min=950.,
    )
# Vertical axis
vertical = maxis(
    axis_orientation='vertical',
    axis_grid='on',
    axis_type='regular',
    axis_tick_label_height=0.4,
    axis_tick_label_colour='charcoal',
    axis_grid_colour='charcoal',
    axis_grid_thickness=1,
    axis_grid_reference_level=0.,
    axis_grid_reference_line_style='solid',
    axis_grid_reference_thickness=1,
    axis_grid_line_style='dash',
    axis_title='on',
    axis_title_text='Pressure',
    axis_title_font='arial',
    axis_title_height=0.5,
    )
# Horizontal axis
horizontal = maxis(
    axis_orientation='horizontal',
    axis_type='date',
    axis_tick_label_height=0.4,
    axis_tick_label_colour='charcoal',
    axis_grid='on',
    axis_grid_colour='charcoal',
    axis_grid_thickness=1,
    axis_grid_line_style='dash',)
#load the csv file, and define how to interpret it
data = mtable(table_filename = "msl.csv",
    table_x_type='date',
    table_variable_identifier_type='index',
    table_x_variable = "2",
    table_y_variable = "3",
    table_header_row = 0
 )
#define the visualisation
graph = mgraph( legend='on' ,
    legend_user_text= '<font colour="navy" size="0.3"> Mean Sea Level</font>',
    graph_line_colour="navy",
    graph_line_thickness= 3, )
#add a title
title = mtext(
            text_lines= ['Mean Sea Level plotted as curve...', ],
            text_html= 'true',
            text_justification= 'left',
            text_font_size= 0.8,
            text_colour= 'charcoal',
        )
plot(output, projection, horizontal, vertical, data, graph, title)
subpage_x_automatic
input_x_type
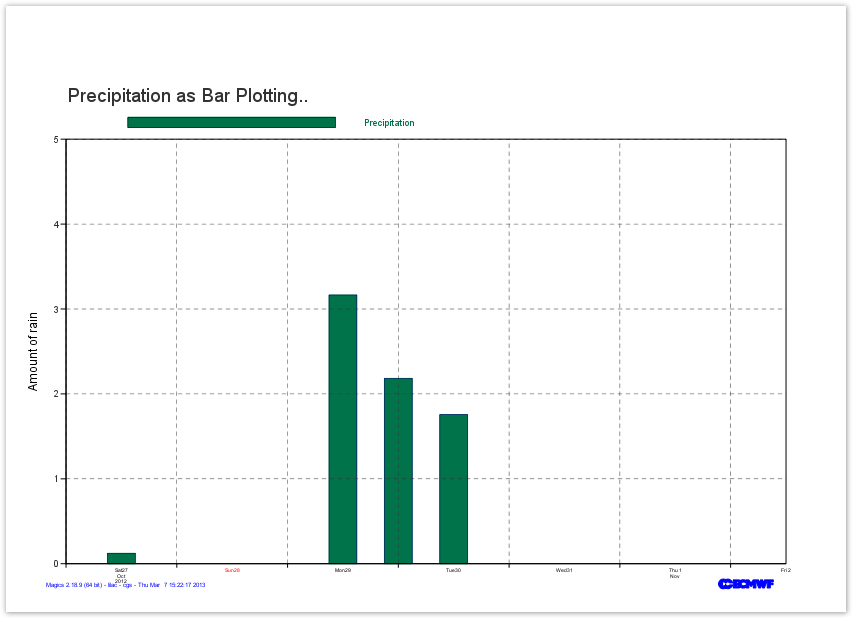
# importing Magics module
from Magics.macro import *
# define the output
output = output(output_formats=['png'],
        output_name_first_page_number='off',
        output_name="time_serie_step3")
# Setting the cartesian view
projection = mmap(
    subpage_map_projection='cartesian',
    subpage_x_axis_type='date',
    subpage_y_axis_type='regular',
    subpage_x_automatic='on',
    subpage_y_max=5.,
    subpage_y_min=0.,
    )

# Vertical axis
vertical = maxis(
    axis_orientation='vertical',
    axis_grid='on',
    axis_type='regular',
    axis_tick_label_height=0.4,
    axis_tick_label_colour='charcoal',
    axis_grid_colour='charcoal',
    axis_grid_thickness=1,
    axis_grid_reference_level=0.,
    axis_grid_reference_line_style='solid',
    axis_grid_reference_thickness=1,
    axis_grid_line_style='dash',
    axis_title='on',
    axis_title_text='Amount of rain',
    axis_title_font='arial',
    axis_title_height=0.5,
    )
# Horizontal axis
horizontal = maxis(
    axis_orientation='horizontal',
    axis_type='date',
    axis_tick_label_height=0.4,
    axis_tick_label_colour='charcoal',
    axis_grid='on',
    axis_grid_colour='charcoal',
    axis_grid_thickness=1,
    axis_grid_line_style='dash',
    )
dates = ["2012-10-27 00:00:00","2012-10-27 12:00:00","2012-10-28 00:00:00",
    "2012-10-28 12:00:00","2012-10-29 00:00:00","2012-10-29 12:00:00",
    "2012-10-30 00:00:00","2012-10-30 12:00:00",
    "2012-10-31 00:00:00","2012-10-31 12:00:00",
    "2012-11-01 00:00:00","2012-11-01 12:00:00",
    "2012-11-02 00:00:00","2012-11-02 12:00:00"]

precip = [0.,0.1220703125,0.,0., 0., 3.16429138184,
        2.18200683594,1.75476074219,0,0,0,0,0,0.]
#defining the data
data = minput(
    input_x_type='date',
    input_date_x_values= dates,
    input_y2_values= precip,
    input_y_values= [0.] * len(precip),
     )
#defining the visualisation
bar = mgraph( legend='on' ,
        graph_type ='bar',
        graph_bar_line_colour = "navy",
        graph_shade_colour = "evergreen",
        legend_user_text= '<font colour ="evergreen" size="0.4"> Precipitation </font>',
        graph_line_colour="navy",
        graph_bar_width = 3600.00 *6,
        graph_line_thickness= 3, )
#adding a title
title = mtext(
        text_lines=  ['Precipitation as Bar Plotting..', ],
        text_html= 'true',
        text_justification= 'left',
        text_font_size= 0.8,
        text_colour= 'charcoal',
    )
plot(output, projection, vertical, horizontal, data, bar, title)