from Magics.macro import *
#setting the output
output = output(
output_formats = ['png'],
output_name = "map_step1",
output_name_first_page_number = "off"
)
#settings of the geographical area
area = mmap(subpage_map_projection="cylindrical",
subpage_lower_left_longitude=-110.,
subpage_lower_left_latitude=20.,
subpage_upper_right_longitude=-30.,
subpage_upper_right_latitude=70.,
)
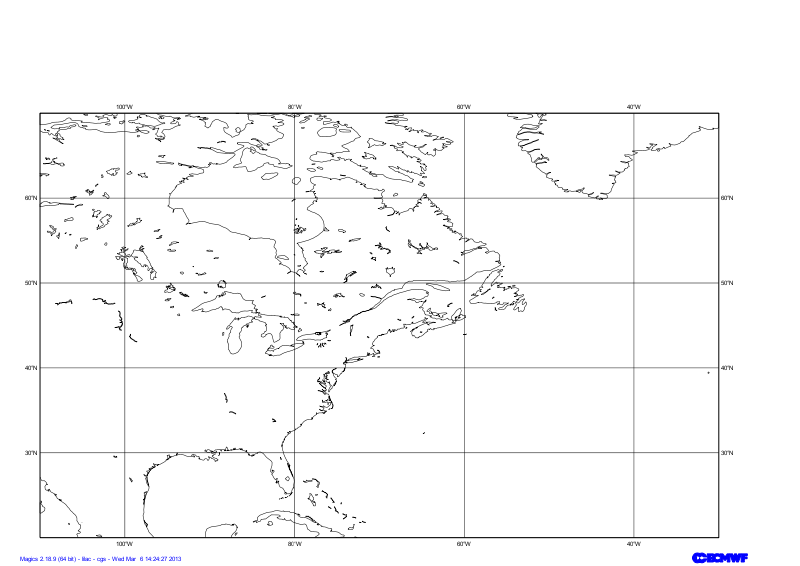
#Using a default coastlines to see the result
plot(output, area, mcoast())
Column
width
200px
...
Section
Column
width
50%
Info
title
Parameters to check
Useful Coastlines parameters
map_coastline_land_shade
map_coastline_land_shade_colour
map_coastline_colour
map_grid_colour
map_grid_line_style
Code Block
theme
Confluence
language
python
title
Python - Coastlines
collapse
true
from Magics.macro import *
#setting the output
output = output(
                output_formats = ['png'],
                output_name = "map_step2",
                output_name_first_page_number = "off"
        )
#settings of the geographical area
area = mmap(subpage_map_projection="cylindrical",
        subpage_lower_left_longitude=-110.,
        subpage_lower_left_latitude=20.,
        subpage_upper_right_longitude=-30.,
        subpage_upper_right_latitude=70.,
    )
 #settings of the caostlines
coast = mcoast(map_coastline_land_shade = "on",
      map_coastline_land_shade_colour = "cream",
      map_grid_line_style = "dash",
      map_grid_colour = "grey",
      map_label = "on",
      map_coastline_colour = "grey")
plot(output, area, coast)
Column
width
200px
...
Section
Column
width
50%
Info
title
Parameters to check
mgrib action to load the data
grib_input_file_name
mcont action to define a contouring
contour_line_colour
contour_line_thickness
contour_highlight_colour
contour_highlight_thickness
contour_hilo
contour_level_selection_type
contour_interval
legend
contour_legend_text
Code Block
theme
Confluence
language
python
title
Python - Msl Visualisation
collapse
true
from Magics.macro import *
#setting the output
output = output(
output_formats = ['png'],
output_name = "map_step3",
output_name_first_page_number = "off"
)
#settings of the geographical area
area = mmap(subpage_map_projection="cylindrical",
subpage_lower_left_longitude=-110.,
subpage_lower_left_latitude=20.,
subpage_upper_right_longitude=-30.,
subpage_upper_right_latitude=70.,
)
#settings of the caostlines
coast = mcoast(map_coastline_land_shade = "on",
map_coastline_land_shade_colour = "cream",
map_grid_line_style = "dash",
map_grid_colour = "grey",
map_label = "on",
map_coastline_colour = "grey")
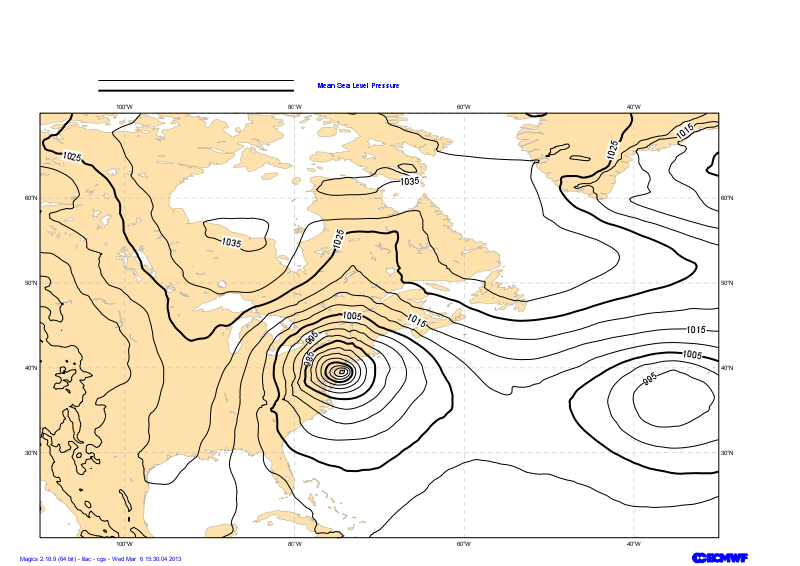
#Loading the msl Grib data
msl = mgrib(grib_input_file_name="msl.grib")
#Defining the controur
contour = mcont(contour_highlight_colour= "black",
contour_highlight_thickness= 4,
contour_hilo= "off",
contour_interval= 5.,
contour_label= "on",
contour_label_frequency= 2,
contour_label_height= 0.4,
contour_level_selection_type= "interval",
contour_line_colour= "black",
contour_line_thickness= 2,
legend='on',
contour_legend_text= "Mean Sea Level Pressure",
)
plot(output, area, coast, msl, contour)