...
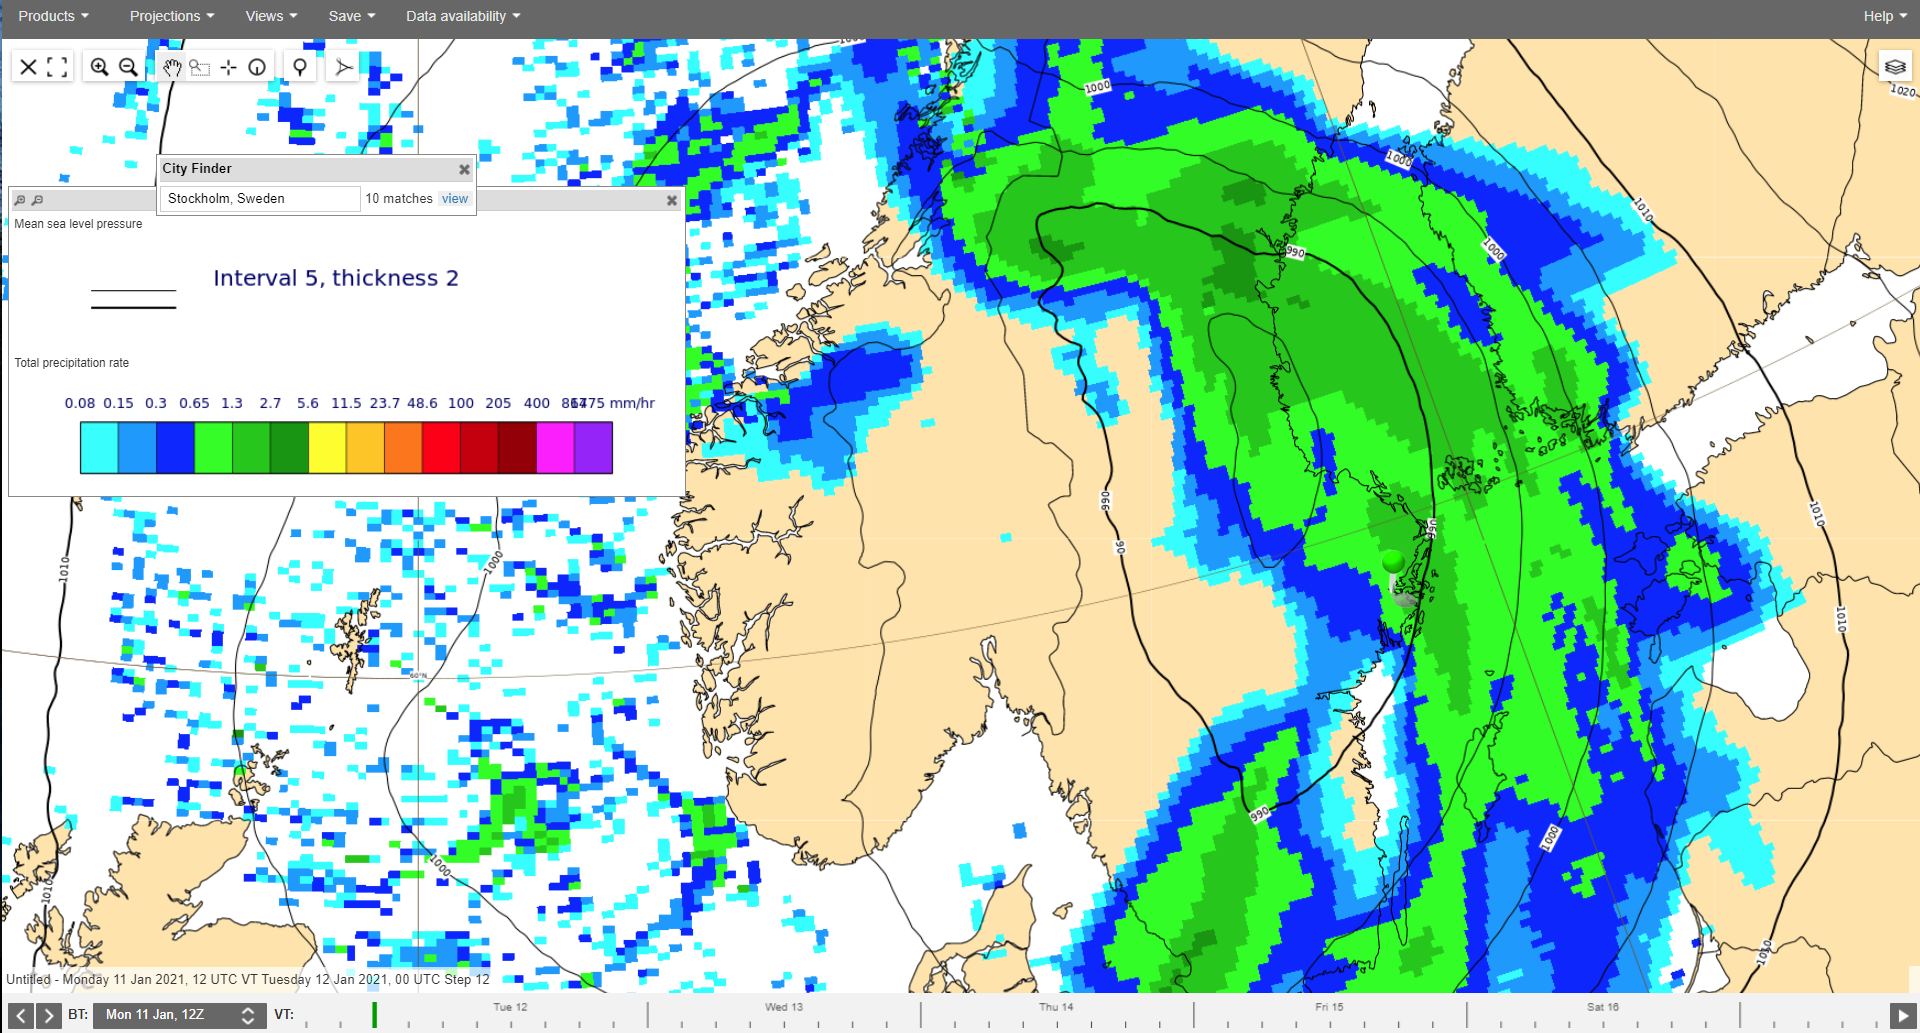
Forecasts from 11 January 12UTC+12 for visibility (left), snowfall rate (middle) and total precipitation rate (right)
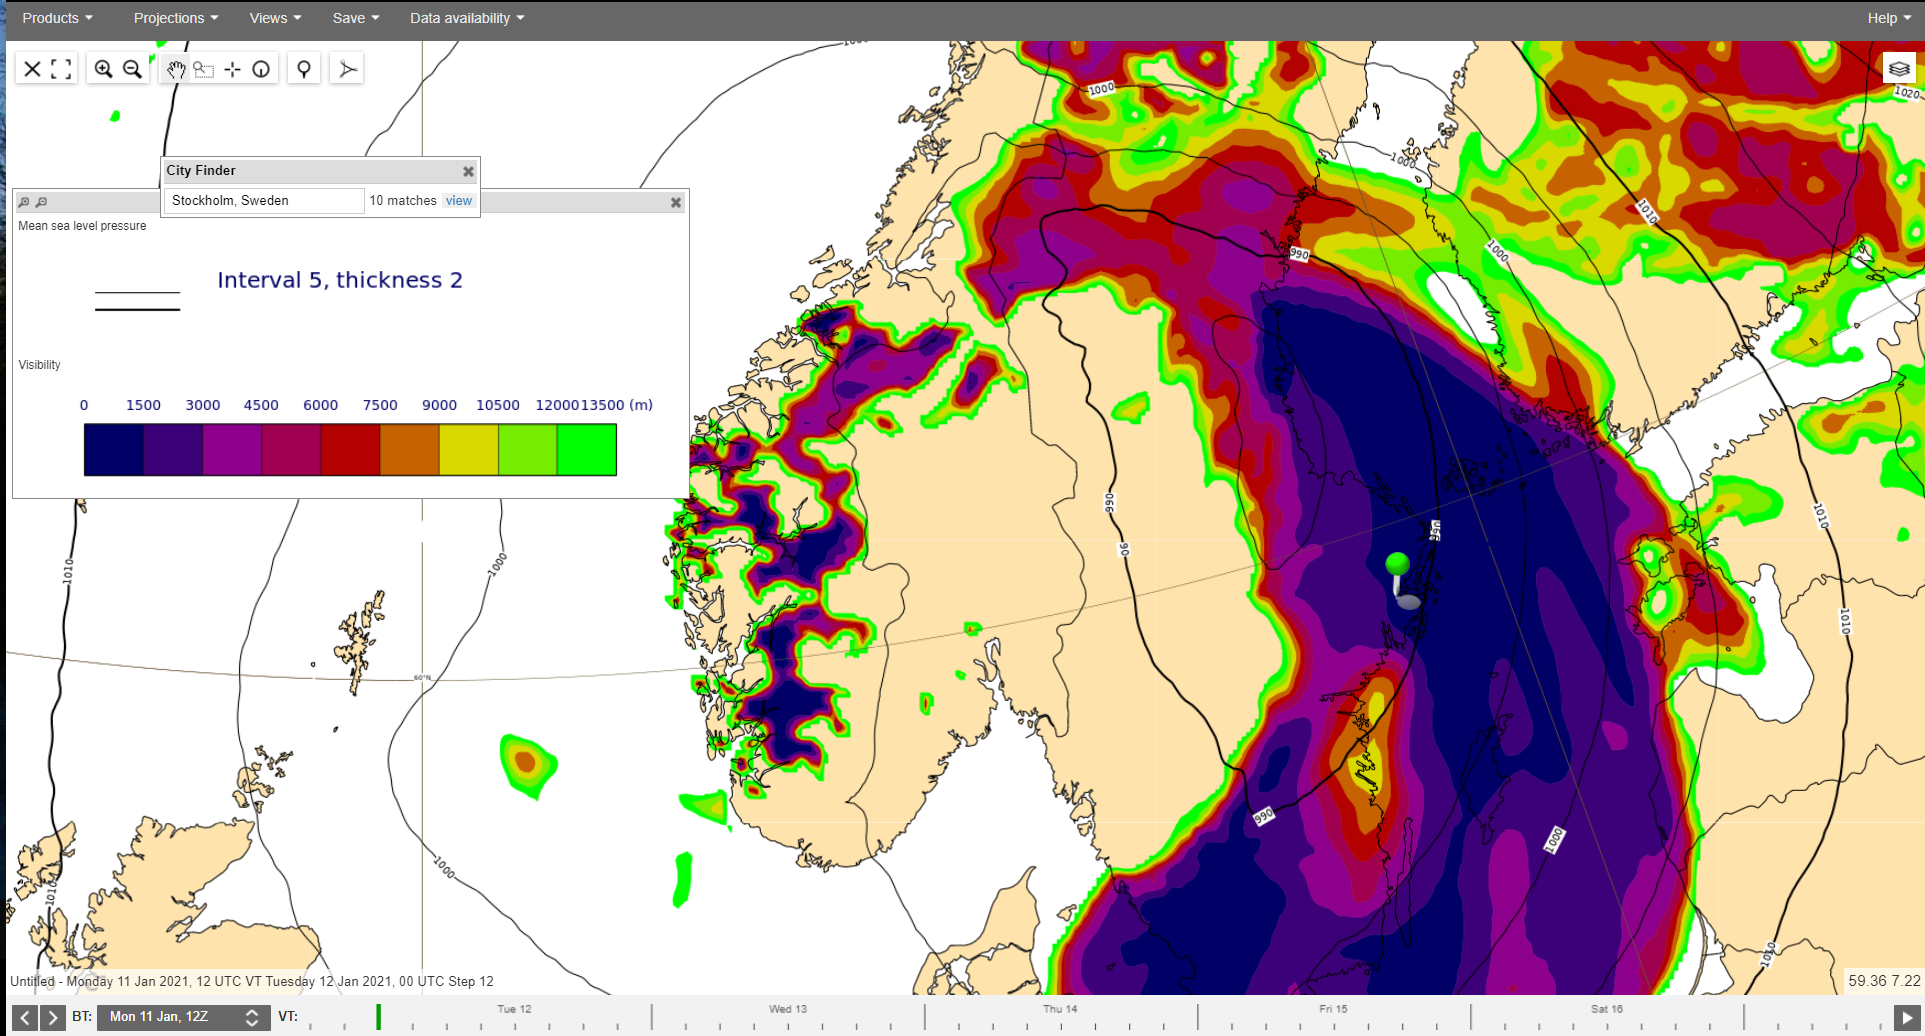

Forecasts from 11 January 12UTC+12 for visibility for operational forecast (left, same as above) and for 47r3 experiment (right).


Metars from 3 airports along the Swedish east-coast:
...
The plot below shows time-series of various parameters for a point in Southern Sweden in the forecast from 11 January 12UTC and the map for precipitation type for step 12.

2-metre temperature
To evaluate the forecasts for the cold spell that followed after the cyclone, the plot below evaluates the forecasts for 2-metre temperature over southern Sweden 14-16 January, for the region outline in the 1-3 day EFI plot for the same period below. The cold signal started to appear on 28 December.


Seasonal anomalies
