...
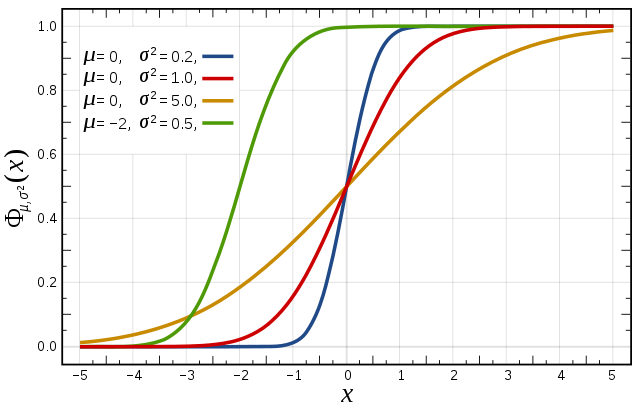
Cumulative distribution function for a normal |
|---|
Figure from Wikipedia. |
| Panel | ||
|---|---|---|
| ||
The idea of the exercise would be to show probabilities of precipitation by two different ways: 1 : CDF The CDF gives for a specific location the probability that the precipitation is below or equal to the percentile p value. This means that the probability of the precipitation being above the value is 1 minus p. The exercise would be to plot the CDF at a specific location (maybe different forecast times), ask if the CDF caracterise a gaussian distribution (answer is not) and answer simple questions by reading the CDF : probability (1-p) that the precipitation exceeds 10mm, 20mm, 30mm, ... 2 : Probability map Probability map give a spatialized information of the precipitation exceeding a specific threshold (i.e. 1-p spatialized) but for just one p value. We can add a question where they set different thresholds and comment the probability maps over the Cevenes. |
Task 1: Cumulative distribution function
...
